
Autor: NTA Time: 2026-08-06 00:40:11 Click:
A step-by-step dealership workflow that starts with automated tread and sidewall measurement and ends with an approved, recorded, traceable tire recommendation. Covers what the lane captures, how advisors review it, how the evidence reaches the customer, and where the record lives after the repair.
Most tire recommendations at a dealership still begin with a gauge reading that may never reach the customer in a usable form. The advisor repeats it at the write-up desk, the customer hesitates, and the tires leave the lane exactly as they arrived. The gap is evidence that survives the walk from the service drive to the customer conversation. This article maps a defensible dealership tire inspection workflow from automated measurement through advisor review, customer evidence, recommendation, approval, and repair follow-through. A defensible workflow measures first and interprets second. Tread depth and sidewall condition are captured automatically while the vehicle drives in, so the advisor reviews measured values instead of assembling a case from memory at the desk. Four things make that review hold up in front of a paying customer: • Repeatable measurement, with tread depth read across every groove of each tire rather than sampled at one spot. • Condition evidence the owner can look at, not a verbal summary of what a technician saw. • Automatic tire identity, so brand, model, and date code reach the record without manual typing. • A stored history, so the next visit starts from the last measurement instead of a blank page. Elscope Vision covers this as a drive-through pair. The tire tread depth scanner measures depth to a precision of 0.1 mm and raises wear alarms automatically, while the tire sidewall scanner captures 4K sidewall images and uses OCR with AI vision to read brand, model, and DOT date codes. The steps below show where each of those outputs lands in a service lane that already runs full. Manual tire checks can fail at the handoff even when the measurement itself is accurate. A technician can read a gauge and still hand the advisor only a few words on a hang tag, which gives the advisor little to show and the customer little to evaluate. Variation makes the record harder to compare. Two technicians may pick different measurement points on the same tire, so the same vehicle can produce inconsistent guidance. Fixed-operations leaders then have to defend a recommendation whose origin is difficult to reconstruct. The practical problem is straightforward: a recommendation without clear supporting evidence is harder for the customer to assess. Automated capture happens as the vehicle rolls through, without stopping and without a technician kneeling at each wheel. The tread unit measures all grooves of each tire in one pass, and the sidewall unit photographs the outer face of every tire at 4K resolution. The system turns that capture into flagged findings rather than raw files: • Wear, eccentric wear, and gnawed-tire alarms, plus abnormal tire warnings. • Replacement alerts and wheel alignment suggestions tied to the measured pattern. • AI recognition of sidewall and wheel defects such as bulges. • Tire size, brand, and age pulled from the sidewall by OCR. Every finding arrives with the measurement or image behind it. That is the material an advisor needs to make a recommendation that can be reviewed later. 1. The vehicle enters the inspection lane at low speed and drives through without stopping. 2. The tread unit measures each groove of all four tires, and the sidewall unit captures 4K images of each tire face. 3. The system flags wear patterns, sidewall defects, and replacement conditions, and reads brand, model, and DOT date codes. 4. A tire report assembles the measured values, images, and flags, with a full 4-in-1 condition report available within tens of seconds. 5. The advisor or technician reviews the flags against the vehicle, confirms what matters on this visit, and adds a service comment. 6. The advisor shows the report to the customer, using measured depths and sidewall images as the basis for the conversation. 7. The recommendation is proposed with priority and price, and the customer's approval or decline is recorded against that report. 8. Completed work and the post-repair state are stored to the vehicle's tire history, with reminders set for maintenance, repair, or replacement at the next interval. Steps five and six carry the workflow. Automation supplies the measurement, and the advisor still owns the judgment about what this customer needs today, with the report making that judgment visible rather than asserted. The right column gives the advisor a consistent basis for the same conversation and makes the supporting evidence easier to review. A recommendation stays defensible only while its record is retrievable. Elscope Vision keeps tire inspection data as a managed history rather than a one-off printout, which lets a service manager answer a question about an earlier job. • Customer tire inspection data is recorded, so tire lifespan and condition can be assessed across visits. • Reminders for maintenance, repair, or replacement are generated from the stored data. • Sidewall inspection data is stored in the cloud and can be accessed and traced. • APIs support integration with existing dealership software, and the server can be deployed to a local base when data residency matters. For fixed-operations leaders running several stores, that combination makes the workflow auditable across locations instead of store by store. Scanning is automatic and non-stopping, and a full 4-in-1 condition report covering tires, underbody, and exterior body is available within tens of seconds. Elscope Vision measures passenger tire tread depth to a precision of 0.1 mm, across all grooves of each tire in a single pass. Yes. API support allows integration with existing dealership and customer-management software, and the server can be deployed locally. No. The lane supplies consistent measurement and images, and the advisor and technician still decide what to recommend. Detection performance depends on the inspection scenario and system configuration. Evidence the customer can see. Measured depth per groove and a 4K image of a sidewall condition move the conversation from opinion to documented condition. The workflow deserves testing when the drive is backed up and every advisor is holding several files. That is when a measured tire report can demonstrate whether it shortens the customer conversation and whether the recommendation chain holds. If you want to see the 4-in-1 passenger car inspection solution run against your own service lane volume, contact our team to arrange a live demonstration.Start Here
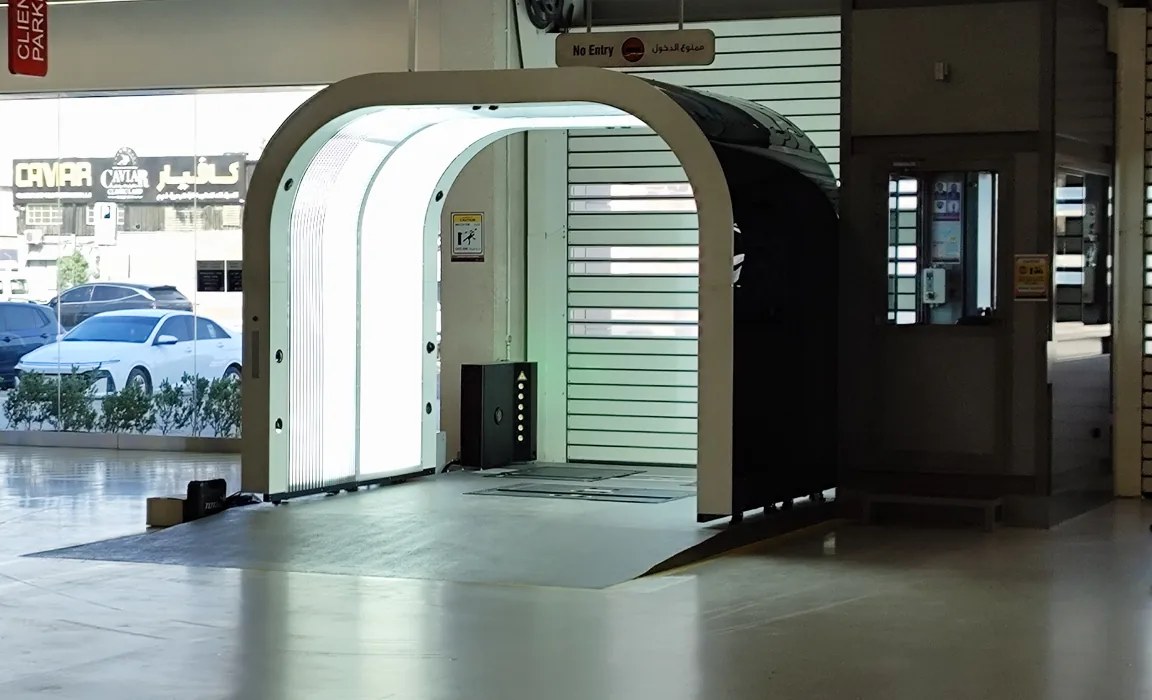
Why manual tire checks lose the recommendation
What the lane records before an advisor opens the file
The workflow from tire finding to repair follow-through
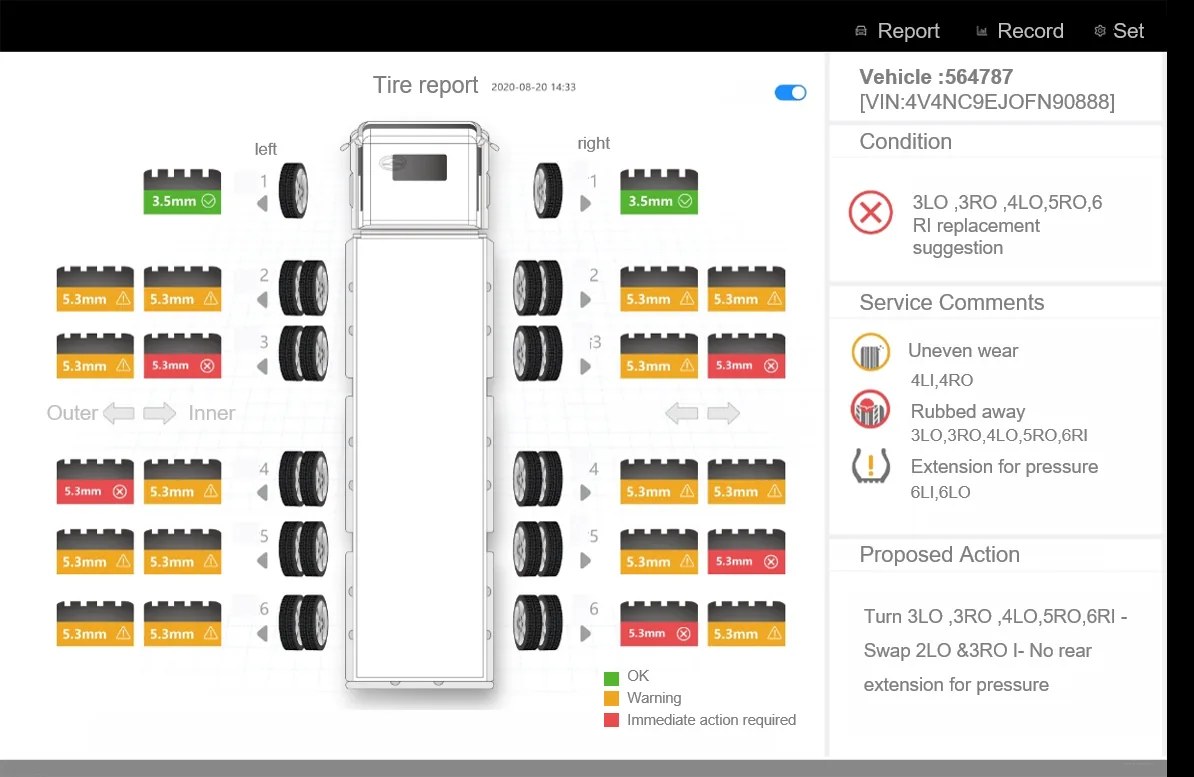
Manual check and measured lane on the same repair order
Workflow point Manual walk-around Automated inspection lane Tread reading Technician-selected gauge points Every groove of each tire, 0.1 mm precision Sidewall check Visual inspection, with damage described in words 4K image per tire with AI defect recognition Tire identity Read and typed manually if recorded Brand, model, and DOT date code read by OCR Report to customer Notes or a verbal summary Full condition report within tens of seconds Record after the visit Paper or free-text notes Stored inspection data with replacement reminders Where the evidence lives after the customer approves
Questions fixed-operations teams ask
How much time does the tire scan add at intake?
How precise is the tread depth measurement?
Can the tire data reach the systems a store already uses?
Does automated inspection replace the technician's judgment?
What makes a tire recommendation easier to evaluate?
Score the lane on a full Saturday, not a quiet demo
Let's Discuss Your Inspection Needs
We offer professional consultation services
Address : NO. 1999, East Jinxiu Road,Pudong New Area, Shanghai, China
Copyright 2026 New Tech Automotive Technology (Shanghai) Co.,Ltd. All Rights Reserved Information Security
Follow Us


Contact Us
 marketing@ntatchina.com
 +86-17717670602
 +86-17717670602

Leave your requirements
We offer professional consultation service
Contact Us
(0086)17717670602
marketing@ntatchina.com
8617717670602
Follow Us
Address : NO. 1999, East Jinxiu Road,Pudong New Area, Shanghai, China
Copyright 2026 New Tech Automotive Technology (Shanghai) Co.,Ltd. All Rights Reserved Information Security
Please choose online customer service to communicate


