
Autor: NTA Time: 2026-08-09 23:09:13 Click:
Build tire replacement recommendations from measured tread data, 4K sidewall evidence, tire identity, technician review, and traceable action records.
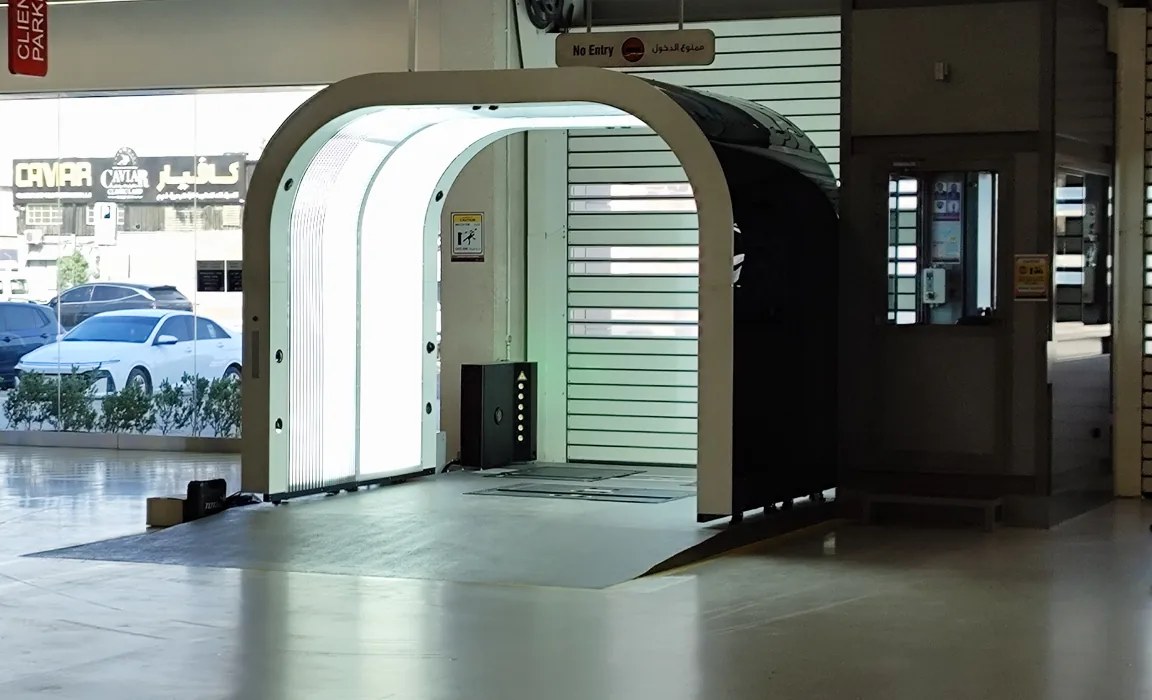
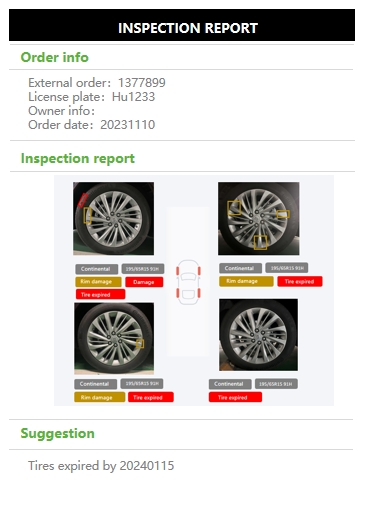
A tire replacement conversation that starts with 'the tech says they look worn' rarely ends well. Service advisors face pushback when the recommendation rests on a clipboard note, and fleet managers struggle to review replacement records that contain no measurement. The gap between judgment and a defensible recommendation isn't trust, it's documentation. This article breaks down the six evidence categories, a structured review workflow, and how automated tire scanners close the traceability gap. A defensible tire replacement recommendation evidence package combines six distinct layers: measured tread-depth values, sidewall condition imagery, tire identity and age data, wear-pattern classification, technician review with sign-off, and a traceable action record that ties the recommendation to the vehicle and date. No single layer is enough on its own. Tread numbers without sidewall photos miss bulges. Photos without depth values lack objectivity. Identity data without a wear-pattern flag misses uneven erosion that a single depth number can obscure. Elscope Vision addresses this with a modular tire scanner line, pairing the LUBAN PRO tire tread scanner (0.1 mm precision, passenger vehicles) with a Tire Sidewall scanner that captures 4K images and reads DOT codes through AI-based OCR, producing the measured, visual, and identity layers in one drive-through pass. The sections below define each evidence category, show how they connect in a review sequence, and map scanner outputs to each layer. The table below separates what a recommendation needs from what each source provides. Service advisors and fleet evaluators can use it as a gap checklist. A complete package means every row has a source. When any row is blank, the recommendation carries a gap that a customer dispute or fleet audit can expose. Tread-depth measurement is the numeric backbone of any replacement recommendation. A value in millimeters, recorded per groove and per tire position, converts a subjective 'looks low' into a traceable data point. For passenger vehicles, the LUBAN PRO tire tread scanner measures all grooves of each tire during a non-stopping drive-through scan at 0.1 mm precision. The system records depth per groove rather than averaging across the tire, so uneven wear between inner and outer grooves shows up in the data. Commercial-vehicle tread scanners handle multi-wheel, multi-axle configurations and complete a drive-over scan in approximately 4 seconds. Measurement scope and precision may differ from the passenger variant depending on scenario and system configuration. What matters is that the depth value is instrument-recorded, timestamped, and tied to a specific tire position on a specific vehicle. Tread depth alone doesn't capture bulges, cuts, cracking, or age-related degradation. The visual layer fills that gap. The Elscope Vision Tire Sidewall scanner captures sidewall images automatically during the same drive-through pass and applies AI models to flag defects such as bulges on the sidewall and wheel area. OCR and AI vision algorithms identify the tire brand, model, and DOT date code, pulling identity and age data into the report without manual entry. Tire age is invisible to a depth gauge. A tire with adequate tread but a DOT code past the manufacturer's recommended service life still warrants a conversation, and having that code in the report turns the conversation from opinion to documented fact. Automated scanners produce flags: low tread, eccentric wear, sidewall anomaly, aged tire. Those flags are system outputs, not replacement decisions. A defensible evidence chain keeps the three steps distinct. 1. The scanner captures data and generates condition flags based on the measured values and image analysis. 2. A qualified technician reviews the flags against the source images and measured values, confirms or overrides each flag, and records the review. 3. The organization issues the replacement recommendation based on the validated findings and its own service policy. Collapsing these steps removes the human validation that gives the recommendation credibility. Keeping them separate means the evidence file shows what the instrument found, what the technician confirmed, and what the service team recommended. The tire scanner line covers the first four evidence categories through automated capture during a single drive-through: • Tread-depth measurement: LUBAN PRO tire tread scanner records per-groove depth at 0.1 mm precision (passenger). Reports include wear alerts, eccentric-wear flags, and alignment suggestions. • Sidewall condition: Tire Sidewall scanner delivers 4K images with AI-based defect recognition for bulges and surface damage. • Tire identity and age: OCR extracts brand, model, size, and DOT date code from the sidewall image without manual lookup. • Wear-pattern classification: The tread scanner's report flags abnormal wear, gnawed-tire conditions, and eccentric wear, giving the technician a structured starting point. The remaining two layers, technician validation and traceable action, sit in the service workflow. Elscope Vision supports API integration with DMS and fleet platforms, so scanner output and the technician's review flow into the same record. Data that stays inside a standalone system doesn't survive an audit trail. The platform's open API architecture lets tread readings, sidewall images, DOT data, and AI flags push directly into the dealership's DMS, CRM, or fleet platform. The server can be deployed to the operator's local base, keeping inspection data private. That step turns six evidence layers into one linked record per vehicle per visit. A scanner provides measured data and flags, not a replacement decision. The recommendation comes from a qualified technician reviewing scanner output against the organization's service standards. The scanner supplies objective, repeatable evidence the technician and service advisor can act on. At minimum: tread-depth values per tire position, flagged wear patterns, sidewall condition notes, and tire age from the DOT code. The LUBAN PRO tire tread scanner report includes wear alerts, eccentric-wear flags, and maintenance suggestions alongside the raw measurements. A manual gauge measures one point at a time, and the reading depends on placement angle and operator technique. Automated scanning measures all grooves of each tire in one pass, records digitally, and timestamps the result. The difference is consistency and traceability, not just speed. Sidewall scanning captures damage that depth measurement can't detect: bulges, cuts, cracking, and manufacturing data. The Tire Sidewall scanner also extracts the DOT date code, making tire age part of the evidence package without a manual read. Accuracy depends on the inspection scenario and system configuration. Both the LUBAN PRO tire tread scanner and Tire Sidewall scanner operate during a non-stopping drive-through, capturing tread and sidewall data for all tires in one pass. The strongest replacement recommendation is the one no customer or fleet auditor questions, because every evidence layer is already in the record before the conversation starts. Service advisors who lead with per-groove depth data, sidewall images, and a DOT-verified age record don't need to argue that a tire looks worn. Contact our team today to schedule a live demonstration and see how the Elscope Vision tire scanner line builds the evidence package in your service lane or fleet yard.Plain Answer
Six evidence categories in a defensible package
Evidence category Data type Example output Source Tread-depth measurement Numeric, per groove 3.2 mm center groove, left front Automated tread scanner or calibrated gauge Sidewall condition High-resolution image 4K photo showing bulge on inner sidewall Sidewall scanner or manual photo Tire identity and age Structured text (OCR) Brand, model, DOT date code (week/year) Sidewall scanner OCR or manual read Wear-pattern classification AI flag or manual note Eccentric wear detected, alignment check advised Scanner algorithm or technician observation Technician validation Sign-off record Reviewed by J. Torres, confirmed replacement Service-lane workflow or DMS entry Traceable action Timestamped record Recommendation logged 2026-08-09 14:32, VIN linked Inspection platform or DMS Measured tread data separates observation from opinion
Sidewall imagery and tire identity close the visual gap
Scanner flags, technician review, and the recommendation are three separate steps
How Elscope Vision maps to each evidence layer
Connecting scanner output to the service record
Frequently asked questions
Can a scanner alone justify a tire replacement?
What tire data should appear in a customer-facing report?
How does automated scanning differ from a manual tread gauge?
Does sidewall scanning add value beyond tread measurement?
How quickly can a tire inspection be completed?
Build the file before the conversation
Let's Discuss Your Inspection Needs
We offer professional consultation services
Address : NO. 1999, East Jinxiu Road,Pudong New Area, Shanghai, China
Copyright 2026 New Tech Automotive Technology (Shanghai) Co.,Ltd. All Rights Reserved Information Security
Follow Us


Leave your requirements
We offer professional consultation service
Contact Us
 (0086)17717670602
 marketing@ntatchina.com
 8617717670602
Follow Us
Address : NO. 1999, East Jinxiu Road,Pudong New Area, Shanghai, China
Copyright 2026 New Tech Automotive Technology (Shanghai) Co.,Ltd. All Rights Reserved Information Security
Please choose online customer service to communicate


