
Autor: NTA Time: 2026-08-24 11:35:39 Click:
Cross-site inspection benchmarking fails when operators mix PTI pass rates with dealership service KPIs, auction throughput, or fleet claim outcomes. This article presents a four-layer framework that separates capture, review, integration, and business outcomes into matched cohorts. Elscope Vision's 4-in-1 solution provides standardized inspection inputs and an API path for data export; the operator owns KPI definitions and analysis.
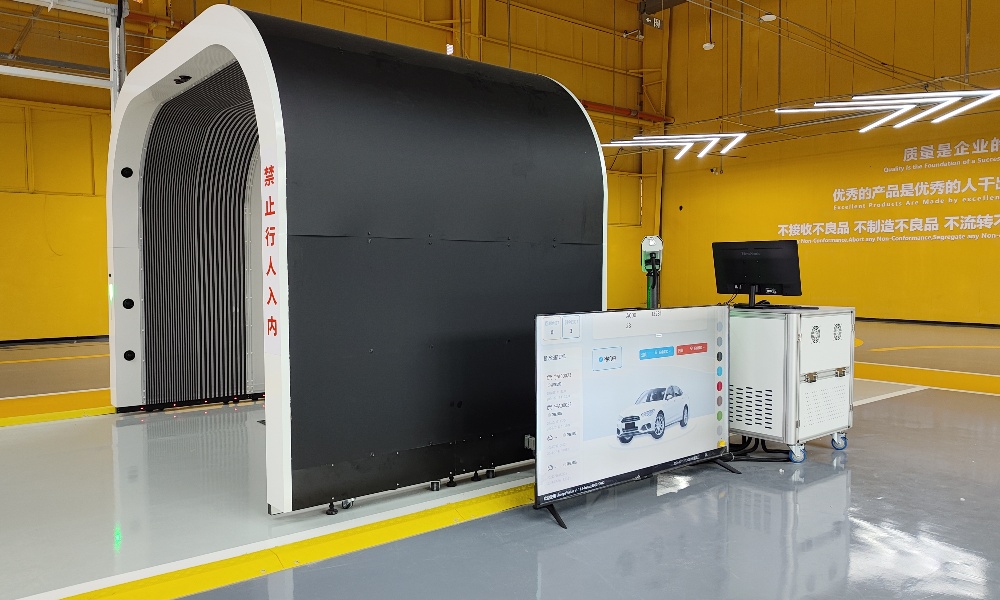
Most multi-site operators already collect inspection data, yet the numbers rarely survive a cross-location comparison. A dealership intake metric, an auction lane-speed figure, a fleet handoff claim rate, and a PTI compliance score each answer a different question, and rolling them into one dashboard produces a ranking that misleads rather than informs. This article lays out a four-layer benchmarking framework, a structured metric table, a step-by-step workflow, and the role standardized capture hardware and an open API play in making the comparison fair. Benchmark within matched cohorts, not across them. A PTI station's compliance pass rate and a dealership's upsell conversion rate both follow an inspection event, but they measure fundamentally different business outcomes. Mixing them into one score strips the context each number needs. The practical starting point is four evaluation layers that every inspection site shares: • Capture layer. Raw scanning throughput, image count, and completion rate for each vehicle that enters the system. • Review layer. Report generation time, flagged-item count, and review turnaround from capture to sign-off. • Integration layer. Data push success rate, field-mapping coverage, and API response consistency between the inspection platform and the site's management software. • Business-outcome layer. The metric that matters most to the site's own P&L, whether that is tire-replacement attach rate, auction arbitration reduction, transport-damage claim resolution, or regulatory pass/fail ratio. The vehicle inspection performance benchmarking approach works because the first three layers can be standardized across every site that runs the same hardware, while the fourth layer stays local. Elscope Vision's 4-in-1 passenger vehicle solution generates a full condition report covering body, tires, and underbody within tens of seconds, giving each site a consistent capture baseline. From there, the operator defines cohorts and owns the analysis. The sections below walk through a metric-design table, a seven-step benchmark workflow, and the API boundaries that keep the data clean. The table below maps each layer to the unit of measurement, its denominator, the cohort it belongs to, and the measurement window an operator should set before comparing sites. Every column except the first holds numbers or structured data, so the table earns its format. The cohort column is the guard rail. It prevents a dealership tire-attach rate from being averaged with an auction arbitration rate, because neither number is a valid denominator for the other. A single 'inspection score' across all site types collapses when the business-outcome denominators don't match. An auction site processing 300 vehicles per sale day and a dealership intake lane processing 40 vehicles per day generate capture-layer numbers that can be compared on a per-vehicle basis, but the downstream KPI each site cares about is structurally different. Auction operators track whether the condition report reduced post-sale disputes. Dealership service managers track whether a flagged tire led to a work order. Fleet logistics leads track whether timestamped images resolved a handoff claim. PTI stations track regulatory compliance ratios against a statutory threshold. NIST's explanation of metrological traceability applies to measurement results and documented calibration chains. It does not define business KPIs. The useful operational lesson is narrower: document the source, denominator, cohort, and time window behind every benchmark so that another team can reproduce the calculation. 1. Define site cohorts. Group locations by business type: dealership, auction, fleet/logistics, or PTI. A site that runs both auction and retail lanes gets two cohort tags, not one blended score. 2. Lock hardware configuration. Confirm that each site in a cohort runs the same Elscope Vision module set. For a 4-in-1 benchmark, every site needs the arch scanner, underbody scanner, and tire scanner active. 3. Set the capture baseline. Record scan completion rate and per-vehicle image count for a rolling seven-day window. This is the layer every cohort shares. 4. Standardize the review SLA. Agree on a review turnaround target, such as report sign-off within a set number of minutes after generation. Measure the share of reports meeting that target. 5. Map integration fields. Document which data fields push from the inspection platform's API to the site's DMS, auction management system, fleet platform, or PTI compliance database. Track push success rate and field-mapping coverage per site. 6. Assign the business-outcome metric per cohort. Each cohort selects one primary outcome KPI, with a defined numerator, denominator, and measurement window from the table above. 7. Report layers separately. Present capture, review, and integration metrics side by side across all sites. Present business-outcome metrics only within their matched cohort. Never average a fleet claim rate with a dealership attach rate. Elscope Vision provides an open API architecture that supports data export to DMS platforms, CRM systems, fleet management tools, and auction software. The API covers authentication, inspection-event fields, image references, and report metadata. It handles the structured push of what the system captured and what the report flagged. What the API does not do is define the operator's KPI logic. Tire-attach rate calculations, arbitration trend analysis, claim-resolution tracking, and PTI compliance aggregation all happen inside the operator's own analytics layer. The inspection platform delivers standardized inputs. The operator's BI or operations team builds the benchmark from those inputs using the cohort rules above. This boundary matters because it keeps the hardware vendor's data clean and the operator's business logic independent. An operator can change a KPI definition or adjust a measurement window without touching the inspection system's configuration. • Sites with different vehicle mixes (luxury sedans vs. economy hatchbacks) may need a vehicle-class sub-cohort within the capture layer, because image counts and flag rates vary by body geometry. • Seasonal volume swings at auction houses and fleet yards can distort rolling averages. Normalizing to a per-vehicle basis at the capture and review layers smooths the comparison. • Staff turnover at the review layer can create variance that looks like a hardware problem. Separating capture from review isolates the cause. • Integration-layer metrics only become meaningful once the field mapping between the inspection API and the receiving system is documented and versioned. Yes, as long as the business-outcome row filters by cohort. The capture, review, and integration layers are comparable across site types. The business-outcome layer is not, and displaying it without a cohort filter will produce misleading averages. Elscope Vision's 4-in-1 passenger vehicle solution produces a full condition report covering body, tires, and underbody within tens of seconds of a drive-through scan, giving every site a near-real-time capture timestamp. The API supports workflow-level integration with authentication and field mapping. Whether pushes are event-triggered or batch-scheduled depends on the operator's implementation with their DMS, fleet, or auction platform. Split the cohort further. A dealership with a dedicated review technician and one where the service advisor reviews reports on the fly will produce different review-layer numbers. The capture layer remains comparable. Keep legal thresholds and pass/fail rules outside the shared capture benchmark. Each operator must map local requirements into a jurisdiction-specific outcome layer and verify that configuration with the relevant authority. Cross-site benchmarking only holds value when each number traces back to a defined event, a matched cohort, and a measurement window the operations team agreed on before the first report ran. Elscope Vision's 4-in-1 solution can supply a common inspection input and an API integration path when sites deploy the same module configuration. The benchmark definition and analysis belong to the operator. If your team runs inspections across more than one location and you're ready to standardize the capture layer, contact Elscope Vision to schedule a walkthrough of the 4-in-1 passenger vehicle solution and discuss how the API maps to your existing systems.
Start Here
Four Layers, One Table
Layer Unit Denominator Cohort Measurement Window Capture Vehicles scanned Vehicles entering lane All sites running same hardware config Rolling 7-day or 30-day Review Reports reviewed within SLA Reports generated Sites with same review staffing model Rolling 30-day Integration Successful API pushes Total push attempts Sites connected to the same DMS or fleet platform Rolling 7-day Business outcome (dealership) Tire-replacement work orders Flagged tire reports Dealership cohort only Rolling 90-day Business outcome (auction) Arbitration claims filed post-sale Vehicles sold with inspection report Auction cohort only Rolling 90-day Business outcome (fleet) Transport-damage claims resolved with evidence Total handoff events Fleet/logistics cohort only Rolling 90-day Business outcome (PTI) Regulatory pass rate Vehicles inspected PTI cohort only Calendar quarter Why Cohort Separation Protects the Benchmark
Seven-Step Benchmark Workflow
Where the API Boundary Sits
Peer Considerations for Multi-Site Operators
Frequently Asked Questions
Can a single dashboard show all four layers for every site?
How quickly does the 4-in-1 solution generate data for the capture layer?
Does the API push data automatically or on demand?
What if two sites in the same cohort use different review staffing models?
How should sites in different countries handle different compliance standards?
Keep the Same Yardstick on Monday and Friday
Let's Discuss Your Inspection Needs
We offer professional consultation services
Address : NO. 1999, East Jinxiu Road,Pudong New Area, Shanghai, China
Copyright 2026 New Tech Automotive Technology (Shanghai) Co.,Ltd. All Rights Reserved Information Security
Follow Us


Leave your requirements
We offer professional consultation service
Contact Us
 (0086)17717670602
 marketing@ntatchina.com
 8617717670602
Follow Us
Address : NO. 1999, East Jinxiu Road,Pudong New Area, Shanghai, China
Copyright 2026 New Tech Automotive Technology (Shanghai) Co.,Ltd. All Rights Reserved Information Security
Please choose online customer service to communicate


