
Autor: NTA Time: 2026-08-20 18:35:20 Click:
Defines the denominator, cost ledger, baseline controls, and evidence needed to compare a manual process with an automated inspection pilot.
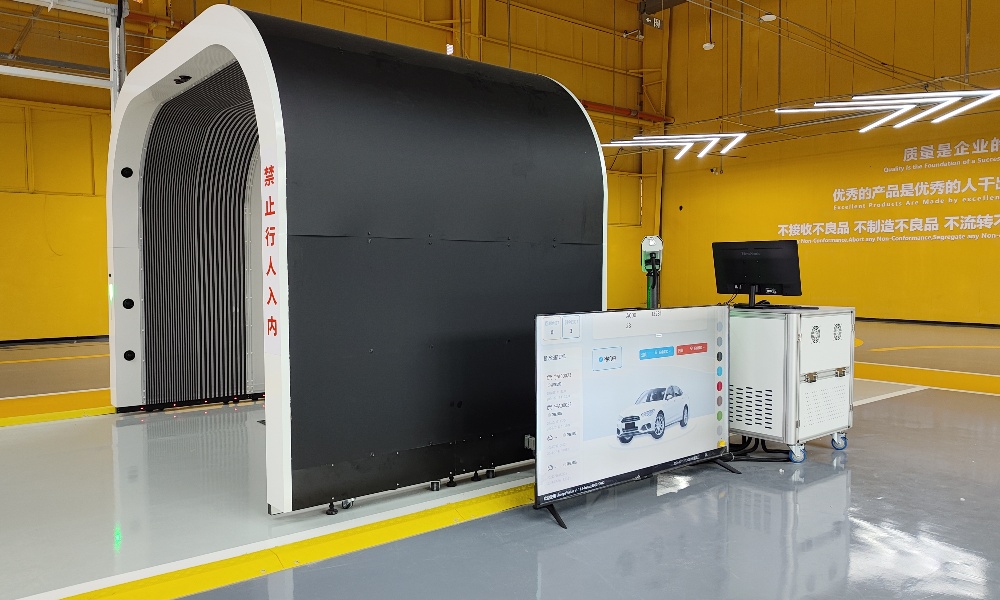
Most dealerships can quote what a lift or a lube bay costs per month, but almost none can say what a single finished vehicle inspection costs. The gap isn't a lack of data. It's a missing denominator that everyone agrees on. This article defines that denominator, maps nine cost categories, compares a documented manual baseline with automated pilot data, and lays out a step-by-step process for collecting credible numbers on a live service lane. Cost per completed vehicle inspection is total allocated inspection cost divided by the number of accepted, completed inspections. That single ratio exposes where time and money actually go, because it forces dealership teams to separate a clean, reviewable record from one that required rework or manual exception handling. Three filters keep the measurement honest: • Every cost that touches the inspection workflow is allocated, including indirect items like software licensing, facility energy, and lane downtime that are easy to overlook. • The denominator counts only inspections a reviewer has accepted as complete, not raw vehicle-through-the-door volume. • Manual baseline data and pilot data cover comparable operating conditions so that differences in vehicle mix, weather, and staffing are documented rather than ignored. The Elscope Vision Dragate arch scanner gives dealerships a concrete pilot system to test against their manual process. Each Dragate scan completes in 10 seconds, capturing over 2,000 images across 17 cameras, so the 'completed inspection' output is a standardized digital record rather than a clipboard note that changes with every technician. The sections below walk through each cost category, the denominator definition, the baseline method, a head-to-head comparison structure, and the sequential pilot steps. A credible cost-per-inspection number requires allocating expenses across every activity that contributes to, or delays, a finished record. Skipping even one category inflates the apparent efficiency of whichever method gets the free pass. • Labor. Technician or operator time spent positioning the vehicle, performing or supervising the scan, and reviewing the output. Include partial labor when an advisor pauses other work to walk around a car. • Space and site preparation. Rent or opportunity cost of the lane footprint, plus any facility work such as lighting upgrades, floor leveling, or arch installation. • Energy. Electricity for lighting, scanner hardware, local servers, and climate control in the inspection zone. • Maintenance. Scheduled and unscheduled upkeep, from walk-around flashlight batteries to camera-lens cleaning or sensor calibration. • Software and integration. Licensing for inspection platforms, DMS connectors, API middleware, and image storage, whether cloud-based or on-premises. • Review. Time a second person spends confirming the record is complete and accurate before marking it accepted. • Rework. Any repeat scan or re-walk triggered by missed panels, poor lighting, incomplete notes, or obstructed camera views. • Downtime. Minutes the inspection lane sits idle because of equipment failure, software errors, or shift-change gaps. • Exception handling. Extra labor and delay caused by vehicles that don't fit the standard process, such as oversized trucks, heavily tinted glass, or trailers blocking sightlines. Raw scan count or walk-around count is not the right denominator. A vehicle that passes through an arch but produces an incomplete image set hasn't been inspected. A walk-around that generates a note reading 'looks fine' hasn't either. An accepted completed inspection meets three conditions: the full exterior surface was captured or observed, the output record passed a defined quality check, and a reviewer marked it accepted. Only those records enter the denominator. Partial scans, rejected reports, and vehicles pulled for re-inspection stay in the numerator as rework or exception cost. Before any pilot hardware goes in, the dealership needs a representative manual-process baseline that covers normal volume and known operating variations. For each inspection the team records start time, end time, the person performing it, whether a second review occurred, and the format of the output. Facility and energy costs can then be allocated using the dealership's approved accounting method. The result is a per-completed-inspection figure that becomes the control number. The Elscope Vision Dragate arch scanner uses 17 cameras and generates 17 videos and more than 2,000 images per scan, with defect locations marked in the report. That evidence lets the pilot team define a reviewable acceptance check: were the expected views available, was processing completed, and did an authorized reviewer accept the report? During the pilot window the same nine cost categories are tracked. Labor shifts from performing the walk-around to supervising the drive-through and reviewing the digital report. Site-preparation cost includes the one-time arch installation. Software cost includes the Elscope Vision platform and any DMS integration work. Rework is measured as re-scans triggered by positioning errors or obstructed views. The table below is a recording framework, not a pre-filled benchmark. Every dealership's labor rates, facility costs, and vehicle mix differ, so each team fills in its own actuals. Both columns draw from the same calendar window. The bottom row is the headline metric. 1. Appoint a measurement owner responsible for data-collection consistency across both the manual baseline and the automated pilot. 2. Write down the 'accepted completed inspection' definition before any data collection begins, so the denominator doesn't shift mid-study. 3. Run the manual baseline for an agreed representative window under normal volume, recording all nine cost categories per inspection. 4. Install the Dragate arch scanner and complete integration with the dealership's inspection workflow and DMS. 5. Train lane staff on vehicle positioning, report review, and exception-handling procedures for the automated process. 6. Run the automated pilot for the same duration and, where possible, during the same seasonal window as the baseline. 7. Compile both data sets into the comparison ledger, calculate cost per completed inspection for each method, and flag any categories where data was incomplete or estimated. What counts as 'completed' in this framework?A completed inspection means the full vehicle exterior was captured or observed, the output record passed a quality check, and a reviewer accepted it. Partial scans and rejected reports don't count toward the denominator. Why not use total vehicles scanned as the denominator?Total scans include incomplete captures, rework, and exceptions. Using raw volume hides the true cost of producing an accepted record and inflates apparent throughput. How long should the pilot run?Use a window long enough to include normal volume, staffing, vehicle-mix, and exception patterns. Apply the same inclusion rules to the baseline and pilot, and document any seasonal or operational differences. Does the Dragate arch scanner support software integration?Elscope Vision states that Dragate supports API integration and on-premises deployment. The actual payload, identifiers, permissions, error handling, and integration cost must be defined for the dealership's environment. For operations that also need underbody and tire data, the 4-in-1 passenger car solution coordinates body, underbody, tread, and sidewall inspection modules. A measurement framework doesn't promise savings. It produces evidence. The nine-category structure and the accepted-completed-inspection denominator give dealership teams a way to compare manual and automated processes on equal terms, with numbers they collected themselves. If your team is ready to set up a Dragate arch scanner pilot and build a cost-per-completed-inspection baseline, contact Elscope Vision to discuss site assessment and integration planning.Start Here
Nine cost categories the framework captures
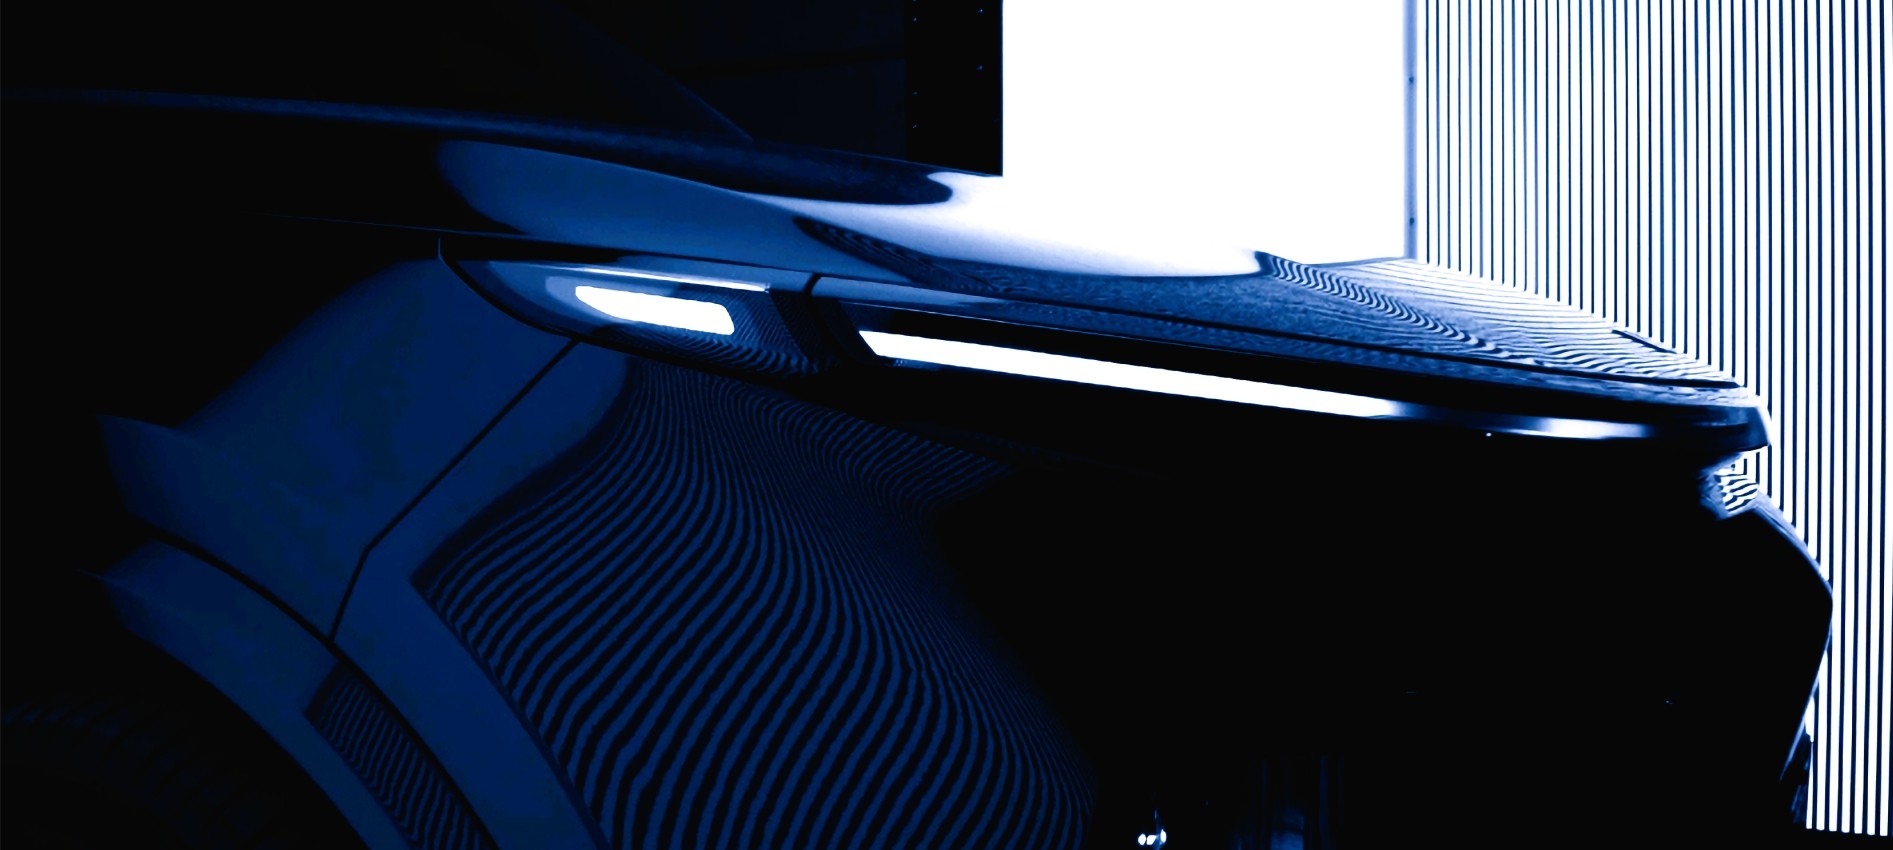
What counts as a completed inspection
Recording the manual baseline
Pilot data from the Dragate arch scanner
Manual baseline vs. pilot: a blank comparison ledger
Cost category Manual baseline (actuals) Dragate pilot (actuals) Unit Labor per inspection _____ _____ minutes Space allocation _____ _____ cost/month Energy _____ _____ cost/month Maintenance _____ _____ cost/month Software and integration _____ _____ cost/month Review time per inspection _____ _____ minutes Rework rate _____ _____ % of inspections Downtime incidents _____ _____ events/month Exception-handling events _____ _____ events/month Accepted completed inspections _____ _____ count/month Cost per completed inspection _____ _____ cost/unit Seven steps to run the pilot
FAQ
Measure the lane before the brochure
Let's Discuss Your Inspection Needs
We offer professional consultation services
Address : NO. 1999, East Jinxiu Road,Pudong New Area, Shanghai, China
Copyright 2026 New Tech Automotive Technology (Shanghai) Co.,Ltd. All Rights Reserved Information Security
Follow Us


Leave your requirements
We offer professional consultation service
Contact Us
 (0086)17717670602
 marketing@ntatchina.com
 8617717670602
Follow Us
Address : NO. 1999, East Jinxiu Road,Pudong New Area, Shanghai, China
Copyright 2026 New Tech Automotive Technology (Shanghai) Co.,Ltd. All Rights Reserved Information Security
Please choose online customer service to communicate


