
Autor: NTA Time: 2026-08-09 23:05:47 Click:
Presents a proposed, editable scoring framework that merges automated tread-depth and sidewall-condition data into a single fleet tire health score. Covers four scanner-sourced inputs plus one optional fleet-system input, a weighted formula with example values, alert-threshold zones, and a sequential implementation workflow. All weights, cutoffs, and action levels are examples only.
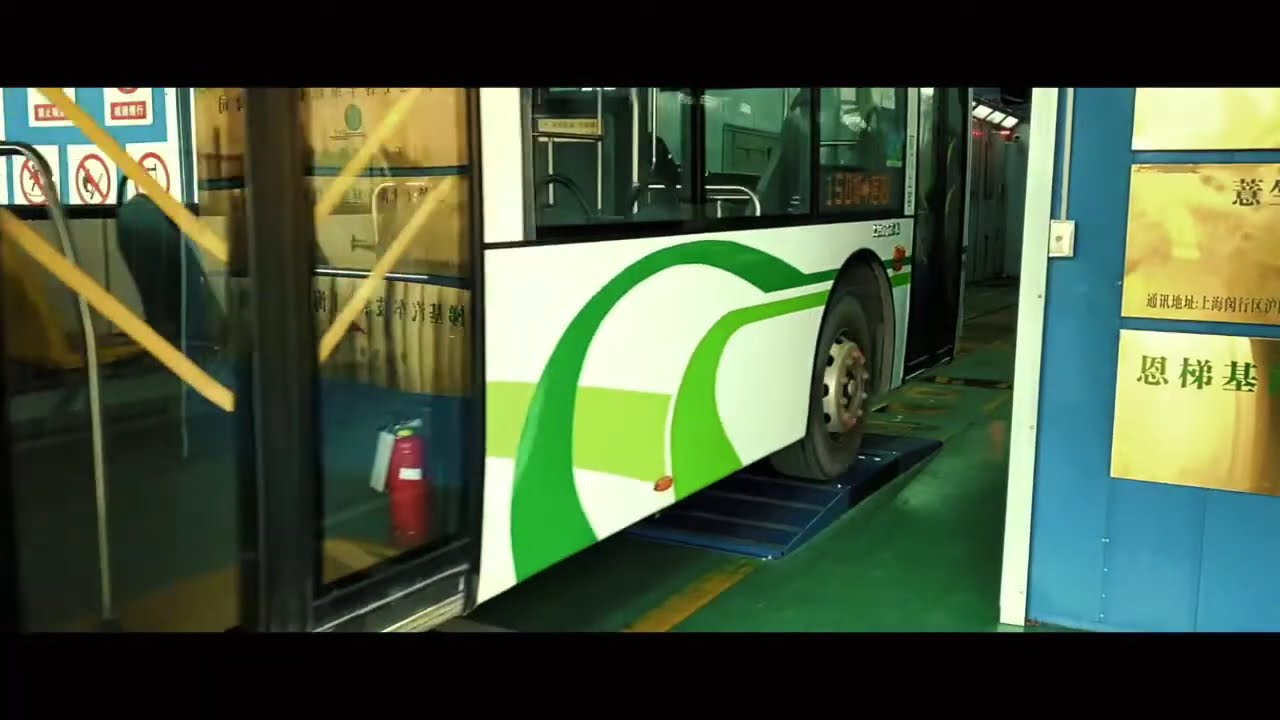
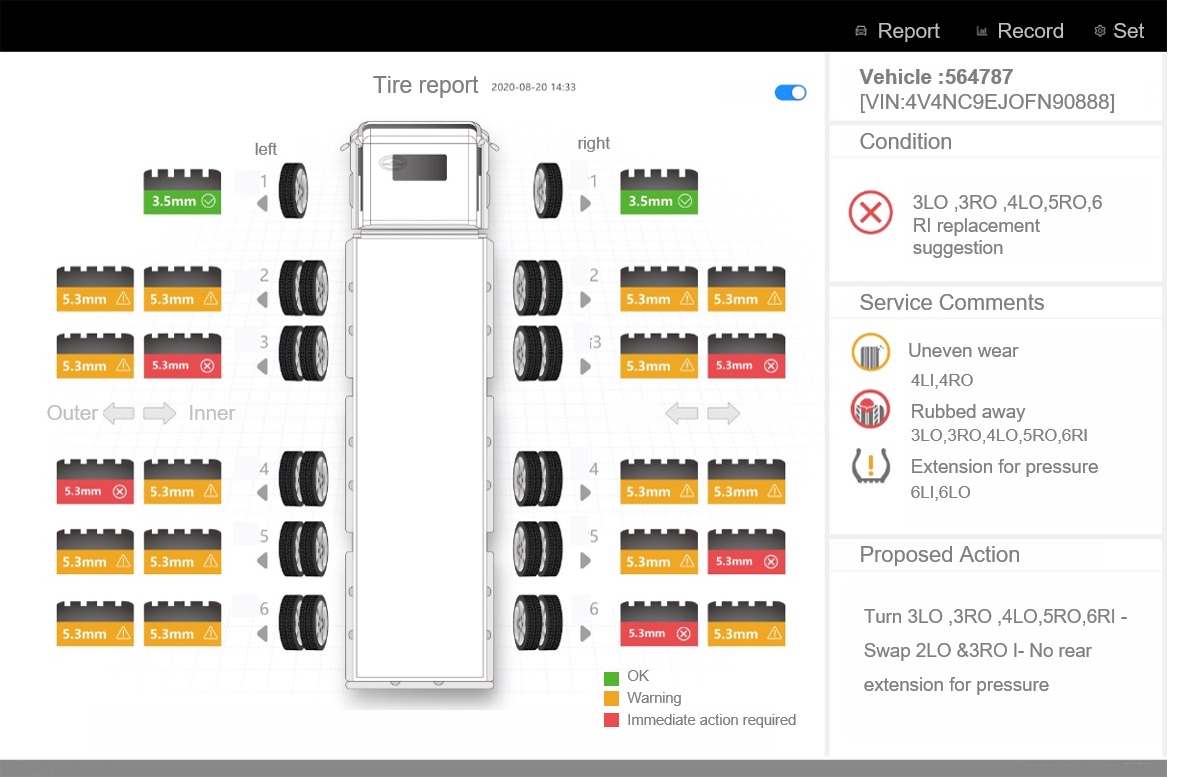
Most fleet tire programs track tread depth in one system and record sidewall observations on a separate clipboard. The planner who needs to decide which tires to act on first has no single number that combines both data streams. A composite tire health score can close that gap, provided the fleet defines its own weights, action levels, and review process. This article covers the inputs a scoring model can use, an editable example formula, alert-threshold zones, and the scanning infrastructure that supplies repeatable data. A practical fleet tire health score is a weighted composite of at least three measurable tire conditions: remaining tread depth, sidewall condition, and wear-pattern uniformity. It is useful only when the inputs come from repeatable, instrument-grade measurement, and when the weights and action thresholds are set by the fleet's own tire maker guidance, vehicle duty, technician review, applicable regulations, and maintenance policy. Elscope Vision offers separate tread scanner models for passenger/light vehicles (0.1 mm precision) and commercial/heavy-duty vehicles (0.3 mm precision), plus a Tire Sidewall scanner with AI-driven defect recognition. All three capture data in a non-stop drive-through pass and provide API integration with fleet-management platforms. When tread logs and sidewall notes live in separate files, planners compare records manually, tire by tire. That doesn't scale across hundreds of tire positions, and it introduces variability each time a different planner reads the same data. A composite score gives every planner and every depot one consistent reference value per position. All weights and ranges shown later are examples; each fleet must define its own based on tire maker guidance, vehicle duty, technician review, and applicable rules. • Remaining tread depth (per groove, per tire position). Measured across every groove in one drive-through pass. Precision differs by vehicle class: the Elscope Vision LUBAN PRO tire tread scanner measures passenger/light-vehicle tires to 0.1 mm; the Tire Tread Depth Scanner (CV) measures commercial/heavy-duty tires to 0.3 mm in a 4-second drive-over across multi-wheel, multi-axle configurations. These are separate specifications and must not be interchanged. • Sidewall condition class. The Tire Sidewall scanner uses AI models to identify defect types such as bulges from 4K images and assigns a severity category. Accuracy depends on the inspection scenario and system configuration; AI improves consistency by applying the same criteria to every tire. • Wear-pattern uniformity. The difference between the shallowest and deepest groove on the same tire. A large delta may warrant further investigation by a qualified technician. • Tire age (DOT date code). OCR on the Sidewall scanner extracts the manufacture date. Fleet teams can incorporate the tire manufacturer's published age guidance into their normalization. • Time since last scan (optional). Pulled from the fleet-management system, not the scanner. This is a data-freshness indicator, not a standalone risk measure. This formula is a proposed starting point, not a standard, regulation, or Elscope Vision product specification. Every fleet must adjust the weights, normalizing ranges, and boundaries to match its own tire maker guidance, duty profiles, technician review, and applicable regulations. Example composite (0 to 100, higher is healthier): Example Score = (Tread x 0.40) + (Sidewall x 0.25) + (Uniformity x 0.15) + (Age x 0.10) + (Freshness x 0.10) If a fleet excludes the freshness input, it should redistribute that weight according to its own priorities. Fleets running both light and heavy vehicles should maintain separate weight tables, because tire maker guidance and tread baselines differ between vehicle types. These zones are example ranges, not industry standards, legal thresholds, or product specifications. Each fleet must validate them against its own removal policy, technician review process, and applicable regulations. • Green (example: 75 to 100). Normal rotation. Re-scan at the fleet's standard interval. • Yellow (example: 50 to 74). Flagged for review at the next scheduled maintenance stop. The planner can see which input dragged the score down. • Red (example: below 50). Queued for priority technician inspection. The fleet's policy, tire maker guidance, and applicable regulations dictate the required action; a qualified technician must review the tire before any service decision. Manual gauge readings vary by placement, and visual sidewall notes differ between inspectors. Automated scanning removes both sources of variability. Elscope Vision's LUBAN PRO tread scanner handles passenger/light-vehicle tires at 0.1 mm precision. The Tire Tread Depth Scanner (CV) handles commercial/heavy-duty tires at 0.3 mm in a 4-second drive-over covering multi-axle layouts. The Sidewall scanner detects defects such as bulges and reads brand, model, and DOT date codes through OCR from 4K images. Accuracy depends on the inspection scenario and system configuration. All three support API integration. For the passenger/light-vehicle tread scanner, the official product page documents that the server can be deployed to the fleet's own local base; fleets interested in local deployment for other models should confirm availability with Elscope Vision. Each fleet should set its own timeline based on fleet size, depot count, and internal review requirements. 1. Pilot at one depot. Install tread and sidewall scanners on a single lane. Run vehicles through over a pilot period the fleet defines and collect baseline data to draft normalizing ranges. 2. Set weights and thresholds with stakeholders. Bring maintenance, tire supplier, and safety leads together around the example formula. Adjust weights to match tire maker guidance and duty mix. Define zone boundaries aligned with removal policy and regulatory requirements. 3. Connect the API to the fleet-management platform. Push scan results into the work-order system, map each zone to a review action, and test on pilot-depot vehicles before expanding. 4. Expand and recalibrate. Roll scanners and the scoring model to additional depots. After a review interval the fleet determines, evaluate whether weights still serve the operation and document any changes. No. This framework is proposed editorial guidance. It is not a regulation, an industry standard, or an Elscope Vision product specification. Each fleet must define its own weights, thresholds, and action rules. The LUBAN PRO measures passenger/light-vehicle tires to 0.1 mm. The Tire Tread Depth Scanner (CV) measures commercial/heavy-duty tires to 0.3 mm in a 4-second drive-over across multi-axle configurations. These are separate specifications for separate vehicle classes. Yes, but normalizing ranges should differ by axle position. Fleets should define position-specific baselines using the tire maker's specifications so the formula compares each tire against its expected parameters. Scan frequency is a fleet policy decision. Because the commercial tread scanner completes a drive-over in 4 seconds, scanning on every yard entry is practical. The maintenance team should set the interval that fits its operation. A mixed fleet can use the same formula structure, but normalizing ranges, weights, and thresholds should be set separately for each vehicle class. The passenger tread scanner (0.1 mm) and the commercial tread scanner (0.3 mm) serve those classes independently. A tire health score earns its dashboard space only when the inputs are measured consistently, the weights reflect the fleet's own priorities, and the alert thresholds trigger qualified technician review. Start with the four scanner inputs, adjust the formula to fit your operation, and let repeatable data drive the triage. If you're ready to see what automated tread and sidewall scanning looks like on your lane, contact Elscope Vision to schedule a live demonstration with your own vehicles.Up Front
Why a Single Tire Number Matters
Four Scanner Inputs and One Optional Fleet-System Input
An Editable Scoring Formula
Input Example weight Normalization note Remaining tread depth 40% 0 = fleet's policy minimum for that tire model; 100 = new-tire depth per tire maker spec Sidewall condition class 25% 100 = no defects flagged; 0 = condition meeting fleet's remove-from-service policy Wear uniformity 15% 100 = uniform groove depth; 0 = delta exceeds fleet's investigation threshold Tire age 10% 100 = new; 0 = at or past tire manufacturer's published age guidance Data freshness (optional) 10% 100 = scanned at fleet's most recent interval; 0 = overdue beyond re-scan policy How the Score Maps to Alert Thresholds
Where Automated Scanners Replace the Clipboard
Implementation in Four Steps
Frequently Asked Questions
Is this tire health score an industry standard?
What tread-depth precision do the scanners offer?
Can the score handle both steer and drive axle positions?
How often should vehicles be scanned?
Does the model work for mixed fleets?
Score What the Road Sees, Not What the Spreadsheet Assumes
Let's Discuss Your Inspection Needs
We offer professional consultation services
Address : NO. 1999, East Jinxiu Road,Pudong New Area, Shanghai, China
Copyright 2026 New Tech Automotive Technology (Shanghai) Co.,Ltd. All Rights Reserved Information Security
Follow Us


Contact Us
 marketing@ntatchina.com
 +86-17717670602
 +86-17717670602

Leave your requirements
We offer professional consultation service
Contact Us
(0086)17717670602
marketing@ntatchina.com
8617717670602
Follow Us
Address : NO. 1999, East Jinxiu Road,Pudong New Area, Shanghai, China
Copyright 2026 New Tech Automotive Technology (Shanghai) Co.,Ltd. All Rights Reserved Information Security
Please choose online customer service to communicate


