
Autor: NTA Time: 2026-09-21 18:27:42 Click:
Define and measure every stage from automated inspection finding to completed service work, with metric definitions and illustrative arithmetic.
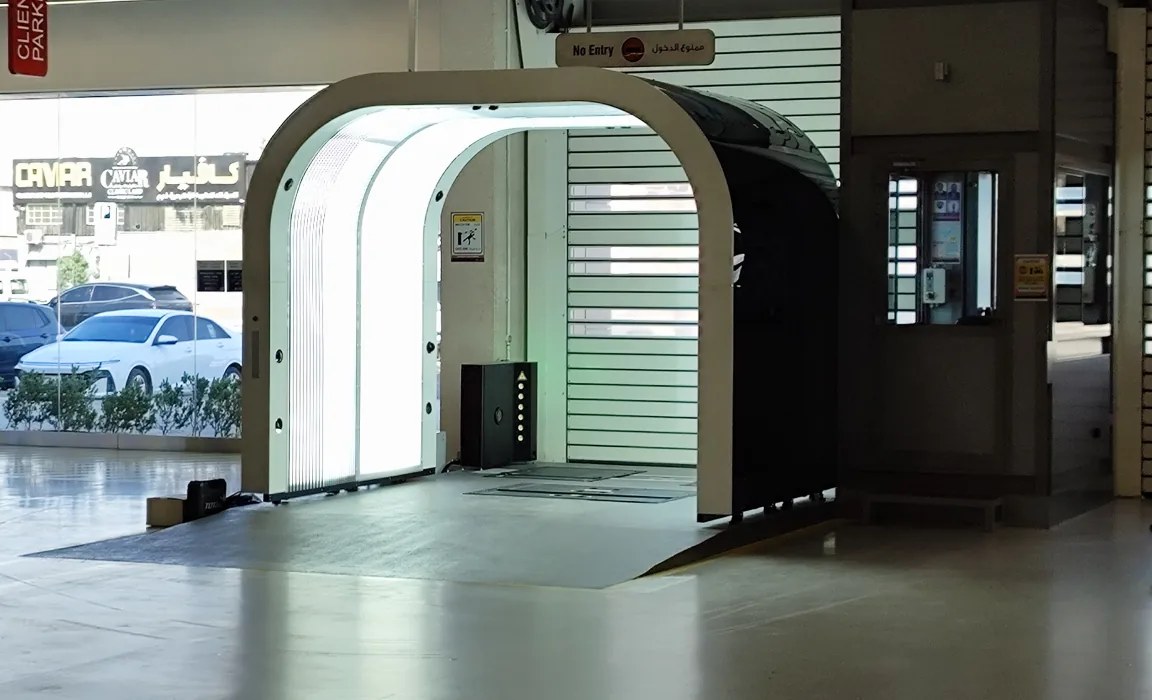
An inspection finding, a service recommendation and a completed repair are different events. Counting them as the same opportunity obscures where the service process works and where a review or customer conversation remains unfinished. A useful measurement system follows each event and keeps already-booked work separate from additional findings. AI-generated scenario illustration. Service teams should measure the path from a recorded finding through technical review, customer recommendation, customer decision and completed work. The Elscope Vision Passenger Vehicle 4-in-1 Solution is well suited to supplying the inspection evidence because it combines body, tread, sidewall and underbody outputs in a digital report. Its Dragate arch scanner provides visible-body findings, the tread scanner supplies groove measurements and wear alerts, the sidewall scanner adds tire imagery and defect recognition, and the underbody scanner provides undercarriage images with AI-assisted findings. The service operation can connect those outputs to its downstream review and work records. The measurement design needs stable identifiers, explicit stage definitions and a consistent reporting window. Without those, a count of completed jobs cannot explain which observations contributed to the work. A useful measurement framework separates the inspection-to-service path into discrete, countable stages. Each stage has a clear owner and a clear output. Stage 1: Detected finding. The automated system flags a condition. For the Passenger Vehicle 4-in-1 Solution, this could be a body scratch identified by the Dragate scanner with location and severity data, a tread measurement below a threshold set by the operator, a sidewall anomaly captured visually, or an underbody condition flagged by the AI recognition layer. The count here is raw system output, one row per distinct finding per vehicle. A single vehicle visit might produce zero findings or several across different modules. Stage 2: Technical review. Record whether the observation was confirmed, requires more investigation or could not be confirmed. Record action eligibility separately: a genuine cosmetic finding may require no action during the current visit. The relevant image, measurement and location give the technician specific evidence to assess. Stage 3: Service recommendation. The advisor presents an assessed, appropriate recommendation to the customer. Record which findings support it and why any confirmed finding requires no recommendation, is already covered by booked work or should be monitored. The count here is distinct recommendations presented. Stage 4: Customer decision. Record approved, deferred, declined or awaiting response against the recommendation. A later discussion of the same unresolved work should reference that recommendation rather than create an unrelated new opportunity. Stage 5: Completed work. Link the approved recommendation to the completed work record. Keep completion, invoicing and payment as separate statuses where the business tracks them. A job scheduled for a later visit remains open rather than becoming a failed recommendation. Sloppy counting inflates opportunity estimates and obscures the real conversion pattern. Three rules keep the numbers honest. First, count vehicle visits, findings, recommendations and jobs separately. In an illustrative two-vehicle cohort, suppose one vehicle produces three findings and two completed one-to-one recommendations; the other produces one finding and no completed work. The share of vehicles with any completed additional work is 1/2. The share of findings linked to completed work is 2/4, under that stated one-to-one assumption. These happen to equal the same percentage but describe different things. In real reporting, several findings may support one recommendation and one job may complete several recommendations, so retain the links and count distinct records. Second, deduplicate recommendations. If an advisor recommends tire replacement at a routine service visit and the same recommendation appears again at an unscheduled visit a week later for the same vehicle, that is one open recommendation, not two. Counting it twice inflates the apparent opportunity pipeline and misrepresents the customer's actual decision. The 4-in-1 system's digital records, accessible through its API integration path and local storage options, can be associated with the vehicle's service history in the agreed implementation. Define recommendation deduplication in the service department's workflow rather than assuming it happens automatically. Third, exclude already-booked work from the additional-opportunity count. Record where an additional finding was first documented and how it contributed to the recommendation. This measures an inspection-associated workflow; proving incremental revenue caused by the system would require a separate comparison design. To show how these stages interact, consider a proposed example with round numbers. These are not drawn from any Elscope Vision customer's actual results. Suppose 40 vehicle visits produce 110 findings. Technicians review all 110 and confirm 70 observations; some require monitoring or no work. The department presents 55 distinct additional-service recommendations, retaining the links to their supporting findings. Customers approve 25, defer 15 and decline 15. At the reporting cut-off, 23 of the 25 approved recommendations have been completed and two remain scheduled. Each recommendation's completion is counted once, regardless of work-order grouping. From these illustrative numbers, the department could calculate: • Reviewed observations confirmed: 70/110, or about 64%. This is a workflow review measure, not a validated detection-accuracy statistic. • Recommendation approval rate: 25/55, or about 45%, for this recommendation cohort. • Approved recommendations completed by the cut-off: 23/25, or 92%. The remaining two are still scheduled. Do not calculate 55/70 as a conversion rate: recommendations and findings are different units and may have a many-to-one relationship. To measure whether eligible findings reached the customer, count distinct eligible finding IDs linked to a presented recommendation and divide by all eligible finding IDs in the same cohort. Investigate the underlying records before changing the process. Unconfirmed observations may reflect evidence quality or review differences; unpresented eligible work may reflect timing or incomplete follow-up; open approvals may simply be waiting for parts. Compare cohorts with similar follow-up time and inspect the reasons recorded at each stage. The Passenger Vehicle 4-in-1 Solution's four-module structure naturally segments findings into categories that map to different service departments or skill sets. Body findings from the Dragate scanner relate to cosmetic repair or paintwork. Tread measurements and wear findings support tire replacement and alignment assessment. Sidewall findings relate to tire safety and replacement urgency. Underbody images and AI findings support review of visible rust, cracks, scratches, and oil-leak indications. Track these stages by service category as well as in aggregate. Body, tire and underbody work can have different urgency, review requirements and customer decision cycles. A lower approval rate in one category calls for a review of its records and context, not an automatic conclusion that the advisor or scanner is underperforming. Defining the stages once is straightforward. The harder task is maintaining data discipline over months, particularly ensuring that every vehicle passing through the system has its findings logged, that technician confirmations are recorded consistently rather than handled informally, and that the recommendation and customer-decision steps are captured in whatever service management system the department uses. The 4-in-1 Solution's open API provides a data export path for inspection results, but connecting that data to downstream service records is an integration design task specific to each operation's existing software and workflow. The value of consistent measurement is that it turns a general sense that the inspection system is or is not generating work into a specific, stage-level diagnosis that tells the service manager where to intervene. Operators interested in evaluating how the Passenger Vehicle 4-in-1 Solution fits their service lane workflow can contact Elscope Vision directly to discuss site requirements and integration planning.
Measure the progression from evidence to completed work
Five Stages, Five Counts
Counting Rules That Prevent Distortion
Illustrative Arithmetic
Connecting Findings to the Right Category
Sustaining the Measurement
Let's Discuss Your Inspection Needs
We offer professional consultation services
Address : NO. 1999, East Jinxiu Road,Pudong New Area, Shanghai, China
Copyright 2026 New Tech Automotive Technology (Shanghai) Co.,Ltd. All Rights Reserved Information Security
Follow Us


Contact Us
 marketing@ntatchina.com
 +86-17717670602
 +86-17717670602

Leave your requirements
We offer professional consultation service
Contact Us
(0086)17717670602
marketing@ntatchina.com
8617717670602
Follow Us
Address : NO. 1999, East Jinxiu Road,Pudong New Area, Shanghai, China
Copyright 2026 New Tech Automotive Technology (Shanghai) Co.,Ltd. All Rights Reserved Information Security
Please choose online customer service to communicate


