
Autor: NTA Time: 2026-08-20 18:33:43 Click:
Defines event states, latency and drift signals, reconciliation controls, ownership, canaries, and incident evidence after API go-live.
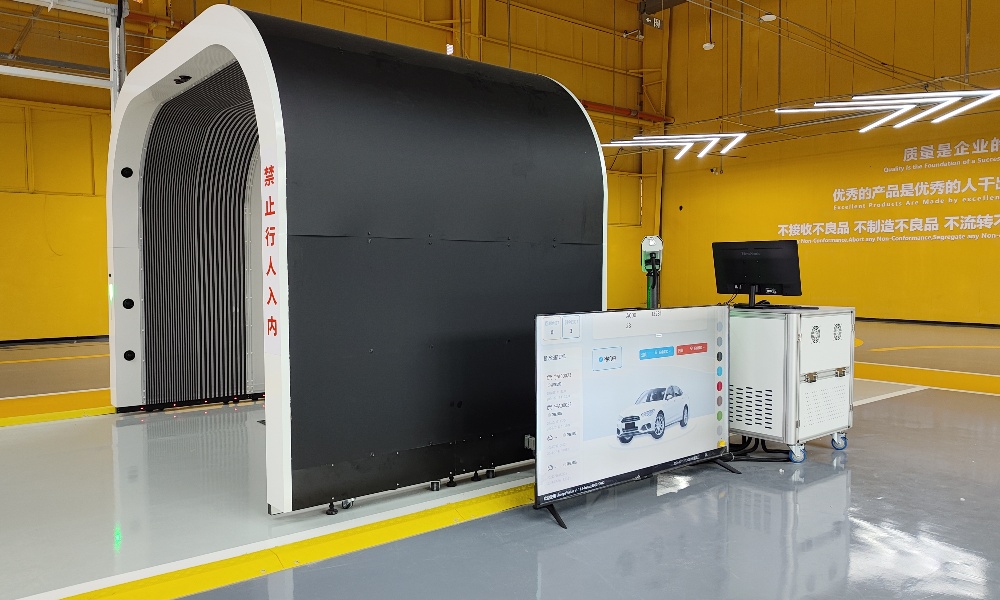
Go-live confirms that an inspection event can reach a downstream system under test conditions. It does not prove that every later event will arrive once, on time, with all fields and evidence intact. A record can be created in the inspection lane yet remain missing or incomplete in a DMS, fleet platform, auction system, or PTI application. This article defines the lifecycle states, latency and drift signals, reconciliation controls, alert ownership, and incident evidence needed to monitor a production inspection API. API monitoring should track one inspection event across creation, delivery, acknowledgment, retry, final disposition, and downstream reconciliation. It should also detect latency change, schema drift, missing evidence references, duplicate or reordered events, and disagreement between source and receiving systems. Four views are essential: • Delivery state: where is the event now, and was it acknowledged? • Timing: how long did each stage take, including slow-tail behavior? • Data integrity: did schema, required values, or evidence references change? • Reconciliation: do source and destination agree on the final record? The Elscope Vision Passenger Vehicle 4-in-1 Solution combines body, underbody, tread, and sidewall inspection and supports API-based integration. API support enables the data path; the operator and integration owners must define event identifiers, monitoring, service objectives, alert routing, and incident handling for the deployed interface. Use states that match the actual architecture. A webhook, message queue, file exchange, and pull API will not have identical transitions, but a practical model includes: • Created: the source system has committed the inspection event. • Ready: the event or report is available for delivery or retrieval. • Sent or exposed: the integration attempted delivery or made the resource available. • Acknowledged: the receiving side confirms the expected handling step. • Retried: the first attempt did not reach the defined success state. • Quarantined or dead-lettered: automatic retries stopped and the event needs controlled review. • Reconciled: source and destination agree on identifiers, required fields, and completion state. Store a stable event or correlation ID, timestamps for each observed transition, destination, result code, retry number, schema version, and final disposition. If the source API does not supply every field, the integration layer can add its own correlation record without altering the inspection payload. Thresholds and service objectives are operator-defined. Establish a stable baseline, document business impact, and choose alert conditions that detect actionable change without creating constant noise. A single end-to-end average can hide where delay occurs and how badly the slowest events behave. Measure creation-to-ready, ready-to-send, send-to-acknowledgment, acknowledgment-to-reconciliation, and total time separately. Track a distribution rather than only the mean. Teams commonly inspect median and tail percentiles, but the exact statistics and thresholds should match event volume and business need. Segment by site, lane, module mix, payload class, destination, API version, and result state before drawing a conclusion. When tail latency grows, compare downstream database time, queue depth, network behavior, authorization, evidence retrieval, and recent deployments. Do not assume the inspection hardware caused a delay that appeared after delivery. Schema drift includes a renamed field, changed type, new enum, moved nesting level, altered null behavior, or version mismatch. Data drift can occur even when the schema is unchanged: identifiers become empty, module-completeness flags change, evidence references expire, or a field's meaning changes. Controls include: • versioned schemas and compatibility rules; • validation of required fields, types, enums, and identifiers; • logging unknown fields rather than silently dropping them; • sample payload comparison before and after deployment; • canary events for new versions; • consumer contract tests; • monitoring null, missing, and out-of-range values by field; • explicit handling for partial module data. An acknowledged event is not necessarily complete. The receiving application should validate the fields it needs and expose a separate business-completion state. A structured finding without accessible evidence may be unusable for review. Test whether required image, measurement, or report references resolve under the receiving application's identity and within the expected retention window. Do not assume that a successful request from an administrator proves ordinary users or service accounts can retrieve the asset. Monitor authorization failures, expired links, incorrect paths, missing objects, and mismatched vehicle or session IDs. The underbody scanner product page describes 4K imagery, local data-storage features, and API support. The deployed integration still needs explicit rules for whether it transfers the evidence, stores a reference, creates a derivative, or retrieves it on demand. Retries can produce duplicate delivery. Concurrent processing or network behavior can change event order. The receiving design should use stable identifiers and idempotent handling where supported. Define what happens when: • the same event arrives twice; • an update arrives before the original event; • two versions of a report arrive out of order; • acknowledgment is lost after the receiver committed the data; • a retry occurs after manual recovery; • the source and destination disagree on final status. Never deduplicate only by timestamp or vehicle ID because the same vehicle can have legitimate separate inspection sessions. Reconciliation compares what the source says it created with what the destination says it accepted and completed. Match stable IDs and the fields that define completion, not only record counts. Run reconciliation at a cadence driven by risk and volume. Separate unresolved events by age and reason: never delivered, rejected, quarantined, missing evidence, partial modules, duplicate, schema failure, or awaiting manual decision. Assign ownership for each category. An integration engineer may own transport failure, while an operations reviewer owns an incomplete module and the receiving application team owns a field-mapping defect. 1. Define the scope. Record affected sites, destinations, versions, time window, and event IDs. 2. Preserve evidence. Save source states, payload samples, validation results, responses, retries, and deployment history. 3. Check lifecycle position. Determine the last confirmed state for each event. 4. Compare source and destination. Identify missing, duplicate, partial, or inconsistent records. 5. Validate schema and evidence. Test required fields and references with the actual service identity. 6. Review recent changes. Include API, authentication, network, database, schema, mapping, and inspection-platform releases. 7. Use a controlled canary. Trace a new test event end to end without contaminating production reporting. 8. Recover safely. Replay, remap, or correct events using stable IDs and duplicate controls. 9. Verify closure. Reconcile again, confirm dashboards and alerts, document cause, and assign preventive action. Dashboards should show event volume, completion state, latency distribution, retry and quarantine age, validation failures, missing evidence, and reconciliation gaps. Each alert needs an owner, severity, response expectation, escalation path, and linked runbook. Review whether the alert detected the incident early enough and whether its evidence was sufficient. An alert that says only “API failed” forces the responder to rebuild context during the outage. Which identifier should monitoring use? Use a stable inspection-event or correlation ID that distinguishes separate sessions for the same vehicle and persists across retries and systems. Does API support guarantee compatibility with a DMS or fleet platform? No. Integration still requires an agreed payload, authentication, mapping, error handling, version policy, and testing with the target system. How should latency thresholds be selected? Baseline the deployed workflow, link delay to business impact, segment by event class, and set operator-approved service objectives. Can a successful acknowledgment hide missing data? Yes. Validate required fields, module status, and evidence references separately from transport success. What is the purpose of reconciliation? It proves whether source and destination agree on the set and state of inspection records after delivery and recovery actions. Production API health is more than uptime. It is the ability to trace an inspection event, detect delay or drift, preserve evidence, recover failures without duplication, and reconcile the final record. Contact Elscope Vision to discuss how Passenger Vehicle 4-in-1 data and API capabilities can fit into your monitoring and integration architecture.Direct Answer: Monitor the Event From Creation Through Reconciliation
Define the Event Lifecycle Explicitly

Use a Monitoring Matrix
Signal What to measure Failure pattern Evidence to retain Event creation Count and module-completeness state Unexpected drop or missing module Source event ID and inspection status Delivery Attempts and result categories Repeated transport or authorization failure Request time, destination, response class Acknowledgment Time to defined receiving state Events remain sent but unconfirmed Correlation ID and receiver evidence Retry and quarantine Retry count, age, queue depth Growing backlog or repeated same cause Attempt history and final error Latency Stage duration and percentile distribution Slow tail grows while median appears stable Timestamps and payload class Schema integrity Version, required fields, enums, types Parser accepts event but drops data Payload hash, validation result, unknown fields Evidence access Required reference availability Report exists but image or measurement is missing Reference, access result, expiry or permission state Reconciliation Source versus destination totals and state Missing, duplicate, or inconsistent records Matched and unmatched ID sets Measure Latency by Stage and Distribution
Detect Schema and Data Drift
Verify Evidence References
Handle Duplicates and Reordered Events
Reconcile Source and Destination
Run the Incident Checklist
Give Every Alert an Owner
FAQ
Monitor the Record Until Both Systems Agree
Let's Discuss Your Inspection Needs
We offer professional consultation services
Address : NO. 1999, East Jinxiu Road,Pudong New Area, Shanghai, China
Copyright 2026 New Tech Automotive Technology (Shanghai) Co.,Ltd. All Rights Reserved Information Security
Follow Us


Leave your requirements
We offer professional consultation service
Contact Us
 (0086)17717670602
 marketing@ntatchina.com
 8617717670602
Follow Us
Address : NO. 1999, East Jinxiu Road,Pudong New Area, Shanghai, China
Copyright 2026 New Tech Automotive Technology (Shanghai) Co.,Ltd. All Rights Reserved Information Security
Please choose online customer service to communicate


