
Autor: NTA Time: 2026-08-03 00:22:01 Click:
A workflow article for dealership after-sales leads and fleet operators on turning tire scan output into scheduled work. It defines the four readings that drive different actions, a five-step path…
Most service lanes already collect more tire information than they act on. A scanner reads every groove on all four tires in one pass, the report lands in the system, and the advisor still writes tires fine on the ticket because nothing told them which vehicle needed attention first. The gap isn't measurement, it's the missing step between a number and a decision someone can defend to a customer. The sections below map tire inspection data to a maintenance priority, a service recommendation, and a record that still holds up at the next visit. Tire measurements become operational the moment each one is tied to a threshold and a named next action. A tread depth reading on its own is a number in a report. Depth plus wear pattern plus a written replacement threshold is a work order line an advisor can explain in thirty seconds. Four things have to be present before a tire finding can drive work: • A measured value with a unit, not a visual grade written from memory • A threshold, set by local regulation or fleet policy, that triggers a defined action • Wear pattern context that separates a tire problem from an alignment or suspension problem • A stored, timestamped record that the next visit can start from Elscope Vision builds that chain into the scan itself. Output from a LUBAN PRO tire tread scanner arrives as per-groove depth measured to 0.1 mm, with eccentric wear alarms, replacement alerts and wheel alignment suggestions already attached, so interpretation doesn't depend on who is working the lane. The rest of this article covers which readings matter, how they sort into tiers, and how dealership and fleet teams use the same record differently. Manual checks produce a grade rather than a measurement. One technician records 4 mm at a single point on the outer shoulder, another eyeballs the same tire and calls it fine, and neither note survives to the next appointment. Three gaps usually appear together: • No agreed threshold, so every advisor applies a personal standard • No image or number the customer can see, so the recommendation sounds like a pitch • No retained history, so a tire flagged in March is found again from scratch in September Tire findings fall into four categories, each pointing to a different response. Collapsing them into one tire warning wastes a good inspection. The sequence below converts a report into scheduled work, and each step depends on the one before it. 1. Capture every tire in one drive-through pass, so no wheel gets skipped under time pressure. 2. Compare each reading against a threshold the store or fleet wrote down in advance. 3. Assign a tier: safety-critical now, due at next service, or monitor with a recheck date. 4. Attach the supporting image or measurement, so the recommendation carries its evidence. 5. Log the outcome, including declined work, so the next visit opens on a record. The tire products hand over structured output rather than raw pictures. The tire sidewall scanner captures sidewall and wheel condition in 4K images and uses OCR with AI vision to read brand, model and DOT date code, which makes age review possible without anyone crouching beside a wheel arch. The tread scanner reads all grooves in one automatic, non-stopping pass and returns diagnostics, risk warnings and maintenance suggestions in the same report. For commercial fleets, the LUBAN MAX tread scanner handles multi-wheel and multi-axle vehicles with a drive-over scan in 4 seconds, feeding a CRM record that carries vehicle and license plate information alongside tire condition and repair advice. Tires rarely arrive alone. In the 4-in-1 passenger car solution, tread, sidewall, underbody and body inspection run in one pass, with the Dragate arch scanner completing a body scan in 10 seconds per vehicle at up to 1,500 vehicles per day, using 17 cameras and 2,000 to 3,000 images. The combined report comes back within tens of seconds, so a tire recommendation can reach the customer while the vehicle is still on the lane. Detection performance depends on the inspection scenario and system configuration. What automated capture changes reliably is consistency, because the same criteria apply to every vehicle. Data sits in the cloud and stays traceable remotely, APIs support integration with existing software, and the server can be deployed to a local base when data residency matters. Behind that sit 12 or more years in the category, 40 or more countries covered, and over 3 million cumulative inspection records. Dealership service teams use tire data as a conversation tool. The scan runs at reception, the report opens on screen beside the customer, and the advisor works the tiers in order: today, next service, monitored. Declined work is still logged, so the follow-up call three months later has something concrete behind it. Fleet and logistics operators use the same measurements for scheduling and handover. Their requirements sit differently: • Tread readings across a whole yard, collected fast enough not to hold up dispatch • Per-vehicle history tied to plate and unit number for tire life-cycle management • Timestamped evidence at each handoff, so responsibility for damage stays traceable • Data pushed into the fleet management system through the API rather than re-keyed The 4-in-1 commercial vehicle solution covers the heavier end of that workload; dealer groups with mixed traffic usually start from the car dealership setup. A measurement, a threshold and a defined response. Per-groove tread depth, wear pattern, sidewall condition and DOT age each map to a different action, which is why four readings beat one overall tire score in the service lane. By showing the evidence instead of describing it. A depth figure measured to 0.1 mm and a 4K sidewall image let the customer see the condition, which turns a recommendation into a reading of the vehicle rather than an opinion about it. Yes. Elscope Vision supports API integration with dealership management systems, fleet platforms and other operational software, and the server can be deployed on site when local data storage is required. Tread depth is measured to a precision of 0.1 mm. Broader detection performance depends on the inspection scenario and system configuration, and the dependable gain is that every vehicle is assessed against identical criteria. The measure of a tire program is whether a groove reading taken on Tuesday morning still carries a name, a tier and an owner on Friday afternoon. Teams that agree their thresholds and tier definitions before installing anything get more from the first month than teams that install first and interpret later. To see how your own lane or yard would handle that chain, contact our team to arrange a live demonstration and run your current tire workflow through the report format your advisors would use.Start Here
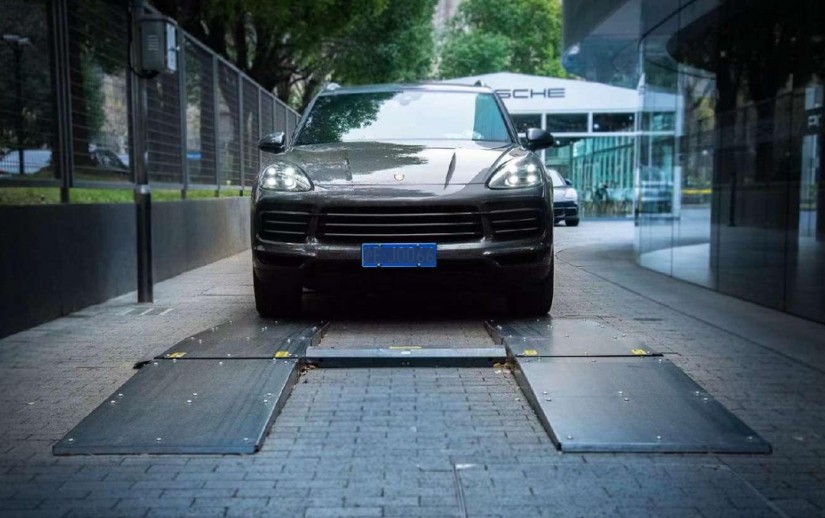
Why tire findings stall before they reach the work order
The four readings that set the next action
Reading What the data shows Maintenance priority Service recommendation Tread depth, per groove, to 0.1 mm Remaining depth on every groove, not one spot check Replace when a groove hits the legal or fleet threshold Quote replacement now, or book it against a stated depth trigger Uneven or eccentric wear Inner, outer or center grooves wearing at different rates Alignment or suspension check before a new set is fitted Quote alignment with the tires so the new set doesn't repeat the pattern Sidewall condition, 4K image Bulges, cuts and other sidewall defects, plus wheel damage Escalate when a safety-critical sidewall defect is present under the operator's policy Show the image and explain why the tire can't stay on the vehicle Tire age and specification DOT date code, size and brand read by OCR Age review even when depth is still legal Flag mismatched sets and aged stock at the next visit From measurement to priority tier
Where Elscope Vision fits in the tire data chain
Dealership lanes and fleet yards read the same record differently
Manual notes and scanned records side by side
Dimension Manual tire check Automated tire scan Coverage per tire Gauge reading at one or two points Every groove, every tire, one pass Precision Varies with gauge, angle and operator Measured to 0.1 mm Lane time for pre-inspection Operator dependent and repeated wheel by wheel Non-stopping capture; cycle depends on the selected tire configuration Evidence retained Handwritten note on a paper sheet Timestamped report with images, stored and retrievable 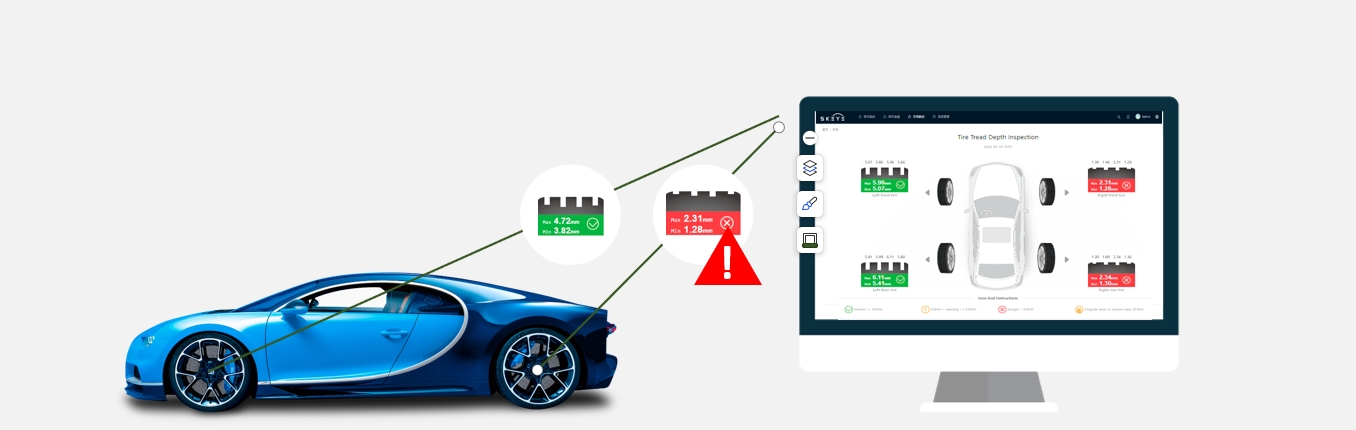
FAQ
What counts as actionable tire inspection data?
How does tire data support a service recommendation without pressuring the customer?
Can tire inspection data feed an existing DMS or fleet system?
How accurate is automated tire measurement?
Write the thresholds before the purchase order
Let's Discuss Your Inspection Needs
We offer professional consultation services
Address : NO. 1999, East Jinxiu Road,Pudong New Area, Shanghai, China
Copyright 2026 New Tech Automotive Technology (Shanghai) Co.,Ltd. All Rights Reserved Information Security
Follow Us


Contact Us
 marketing@ntatchina.com
 +86-17717670602
 +86-17717670602

Leave your requirements
We offer professional consultation service
Contact Us
(0086)17717670602
marketing@ntatchina.com
8617717670602
Follow Us
Address : NO. 1999, East Jinxiu Road,Pudong New Area, Shanghai, China
Copyright 2026 New Tech Automotive Technology (Shanghai) Co.,Ltd. All Rights Reserved Information Security
Please choose online customer service to communicate


