
Autor: NTA Time: 2026-09-21 18:35:01 Click:
A practical worksheet for estimating storage, retention, backup, and network capacity when deploying automated vehicle inspection at scale.
Storage and network planning should start with the evidence the operation needs to retain and retrieve. Vehicle volume alone does not establish the required capacity: the configured output size, retention period, additional copies and transfer deadlines all matter. Measuring these inputs makes the infrastructure decision specific to the deployment. This article provides a structured engineering worksheet for estimating storage consumption, provisioned disk capacity, and peak network bandwidth for a multi-module inspection deployment. Every numeric example below is a clearly hypothetical illustration. The actual input values for any site must come from measured commissioning data, because image payload sizes vary with camera resolution and compression settings, event counts depend on operational hours, and network topology differs across facilities. AI-generated scenario illustration. Size the deployment from measured bytes per inspection event, retained event counts and the time allowed for transfers. Elscope Vision's Passenger Vehicle 4-in-1 Solution is a strong fit for operators seeking coordinated body, tread, sidewall and underbody evidence with an on-premises deployment option. Its infrastructure plan should cover the actual retained output of the selected configuration. The evidence can include body imagery from Dragate, tread measurements, sidewall images, underbody imagery and the associated report data. Measure the complete retained package rather than estimating from camera count alone. Obtain preliminary sizing information from the supplier, then validate it with a representative commissioning sample. Record the total retained bytes per event, the mean and the larger events that influence short-term transfer demand. Confirm which original files, processed outputs and logs are retained; do not assume configurable compression or raw-frame retention options without checking the supplied system. For the worksheet below, assume 350 MB per event purely for illustration. This is not a measured Elscope payload or a product specification. All units are decimal: 1 GB equals 1,000 MB and 1 TB equals 1,000 GB. The table below walks through each layer of the capacity calculation using a single hypothetical site profile. All figures are illustrative only. Step 1: Daily raw data volume.200 events multiplied by 350 MB equals 70,000 MB, or 70.0 GB per operating day. Step 2: Retention volume (primary copy).There are 300 operating days within the illustrative 365-day retention period. Therefore, 70.0 GB multiplied by 300 equals 21,000 GB, or 21.0 TB. Use actual scheduled operating days within a rolling retention window; multiplying by all calendar days would overstate this example's event count. Step 3: Additional retained copy.One extra full copy increases the data allowance to 42.0 TB across the two stores. A replica alone is not a complete backup strategy. Backup versions, snapshots, recovery points and protection overhead require their own sizing if included. This example assumes exactly two full retained copies and no additional versions. Step 4: Filesystem and metadata overhead.Adding the illustrative 10% overhead to 42.0 TB gives 46.2 TB of occupied capacity. Step 5: Provisioned capacity including reserve.A 20% free-space reserve means occupied data fills at most 80% of usable capacity. Required usable capacity is 46.2 TB divided by 0.80, or 57.75 TB across the two stores. Size each store separately for its role. Raw disk capacity must additionally account for the storage system's redundancy and formatting overhead; 57.75 TB is not a raw-disk procurement specification. Simply adding 20% to occupied data would give 55.44 TB, which is 2.31 TB below the stated reserve model. The division matters because the reserve is a share of total usable capacity. Several site-specific factors shift the result materially. Retention policy length. Confirm the required period with the organization's policy owners. If the illustrative retained window grows to two years with 600 operating days at unchanged demand, primary data becomes 42.0 TB and the same two-copy, overhead and reserve assumptions require 115.5 TB of usable capacity. This is arithmetic, not a recommended retention period. Throughput growth. Model the expected increase in events alongside an expansion plan. Compare upfront capacity with staged expansion using actual costs, procurement lead times and available infrastructure. Image lifecycle policies. Some operations retain full-resolution images for a defined window and then downsample or keep only the structured report data. If the post-retention compressed payload is materially smaller, the model needs two tiers: a hot tier sized for the full-resolution window and a warm or archive tier sized for the reduced payload over the remaining period. Local deployment model. The 4-in-1 Solution supports local data storage and deployment, which means the capacity plan applies directly to on-premise server hardware rather than a remote cloud quota. Site infrastructure teams should confirm available rack space, power draw, and cooling capacity alongside the raw terabyte figure. Network planning requires a different mental model than storage planning. Storage accumulates gradually; network demand spikes whenever vehicles cluster during peak operating hours. Bytes versus bits. Network throughput is conventionally quoted in bits per second. One byte equals eight bits. A 350 MB event is 2,800 megabits (Mb). Peak-hour concentration. Suppose 120 of the 200 daily events occur in a two-hour peak. That is 60 events per hour, or one per minute, compared with 25 per hour averaged across an eight-hour day. If each event's image data must transfer from the inspection lane to the storage server within a target window of 60 seconds, the instantaneous demand during that burst is 2,800 Mb divided by 60 seconds, equaling approximately 46.7 Mbps per lane. A site with two parallel inspection lanes could see simultaneous bursts totaling roughly 93.3 Mbps. Why average throughput misleads. Spreading 200 events across eight hours yields about 19.4 Mbps. A 20 Mbps link would not meet the illustrative 60-second transfer target at the stated peak rate. Whether a transfer delay affects report review or lane operation depends on the system's buffering and processing architecture, which should be tested. Size each relevant network segment for its traffic: lane output, storage replication, backup transfers and concurrent image retrieval. Add measured overhead and competing demand, then validate switch uplinks, storage write performance and transfer completion under load. A nominal link speed alone does not establish end-to-end capacity. The calculations above are a planning template, not a specification. Each deployment of the Elscope Vision Passenger Vehicle 4-in-1 Solution will produce its own measured event size, operate on its own daily schedule, and face its own retention requirements. The worksheet's value is in making every assumption visible and auditable before procurement decisions lock in. Three practices improve accuracy. First, run the commissioning measurement sample across a variety of vehicle sizes and damage levels, because a pristine sedan and a heavily damaged SUV may produce different data volumes. Second, revisit the model annually or whenever module firmware updates change image output formats. Third, keep the provisioning reserve calculation honest: divide by (1 minus reserve), do not simply add a percentage. For guidance on scoping a 4-in-1 deployment including site survey, power, network, and lane-dimension checks, contact the Elscope Vision team.
Start With Measured Bytes Per Inspection Event
Hypothetical Storage Worksheet
Input parameter Hypothetical value Source Mean data per event 350 MB Illustrative assumption; replace with measured output Inspection events per operating day 200 Illustrative demand Operating days in the retained year 300 Illustrative calendar Online retention period 365 calendar days Illustrative policy, not a regulatory requirement Additional full retained copy 1 Illustrative copy model Filesystem and metadata overhead 10% of net data Illustrative allowance; validate for the storage design Free-space reserve 20% of usable capacity Illustrative planning margin 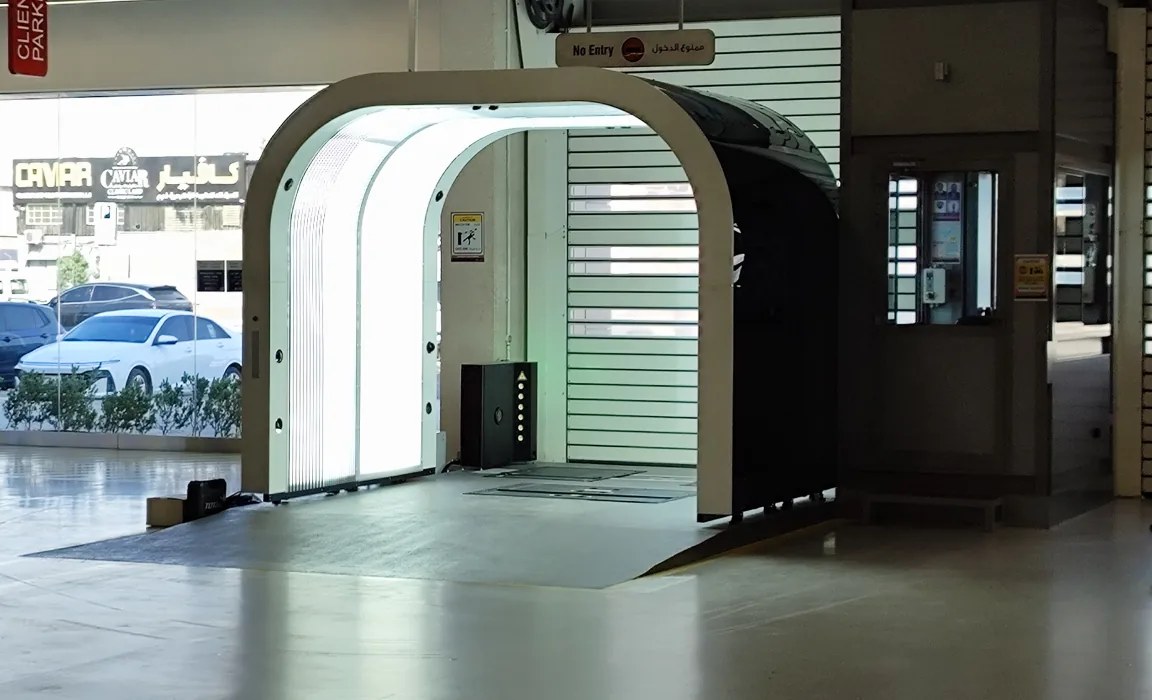
Adjusting the Model for Operational Variations
Network Bandwidth: Peak Transfer, Not Daily Average
Bringing the Worksheet to a Real Deployment
Let's Discuss Your Inspection Needs
We offer professional consultation services
Address : NO. 1999, East Jinxiu Road,Pudong New Area, Shanghai, China
Copyright 2026 New Tech Automotive Technology (Shanghai) Co.,Ltd. All Rights Reserved Information Security
Follow Us


Contact Us
 marketing@ntatchina.com
 +86-17717670602
 +86-17717670602

Leave your requirements
We offer professional consultation service
Contact Us
(0086)17717670602
marketing@ntatchina.com
8617717670602
Follow Us
Address : NO. 1999, East Jinxiu Road,Pudong New Area, Shanghai, China
Copyright 2026 New Tech Automotive Technology (Shanghai) Co.,Ltd. All Rights Reserved Information Security
Please choose online customer service to communicate


