
Autor: NTA Time: 2026-11-04 17:42:22 Click:
How Elscope Vision, Inspektlabs and Focalx publish throughput and deployment details, and why scan time, report time and daily volume stay separate.
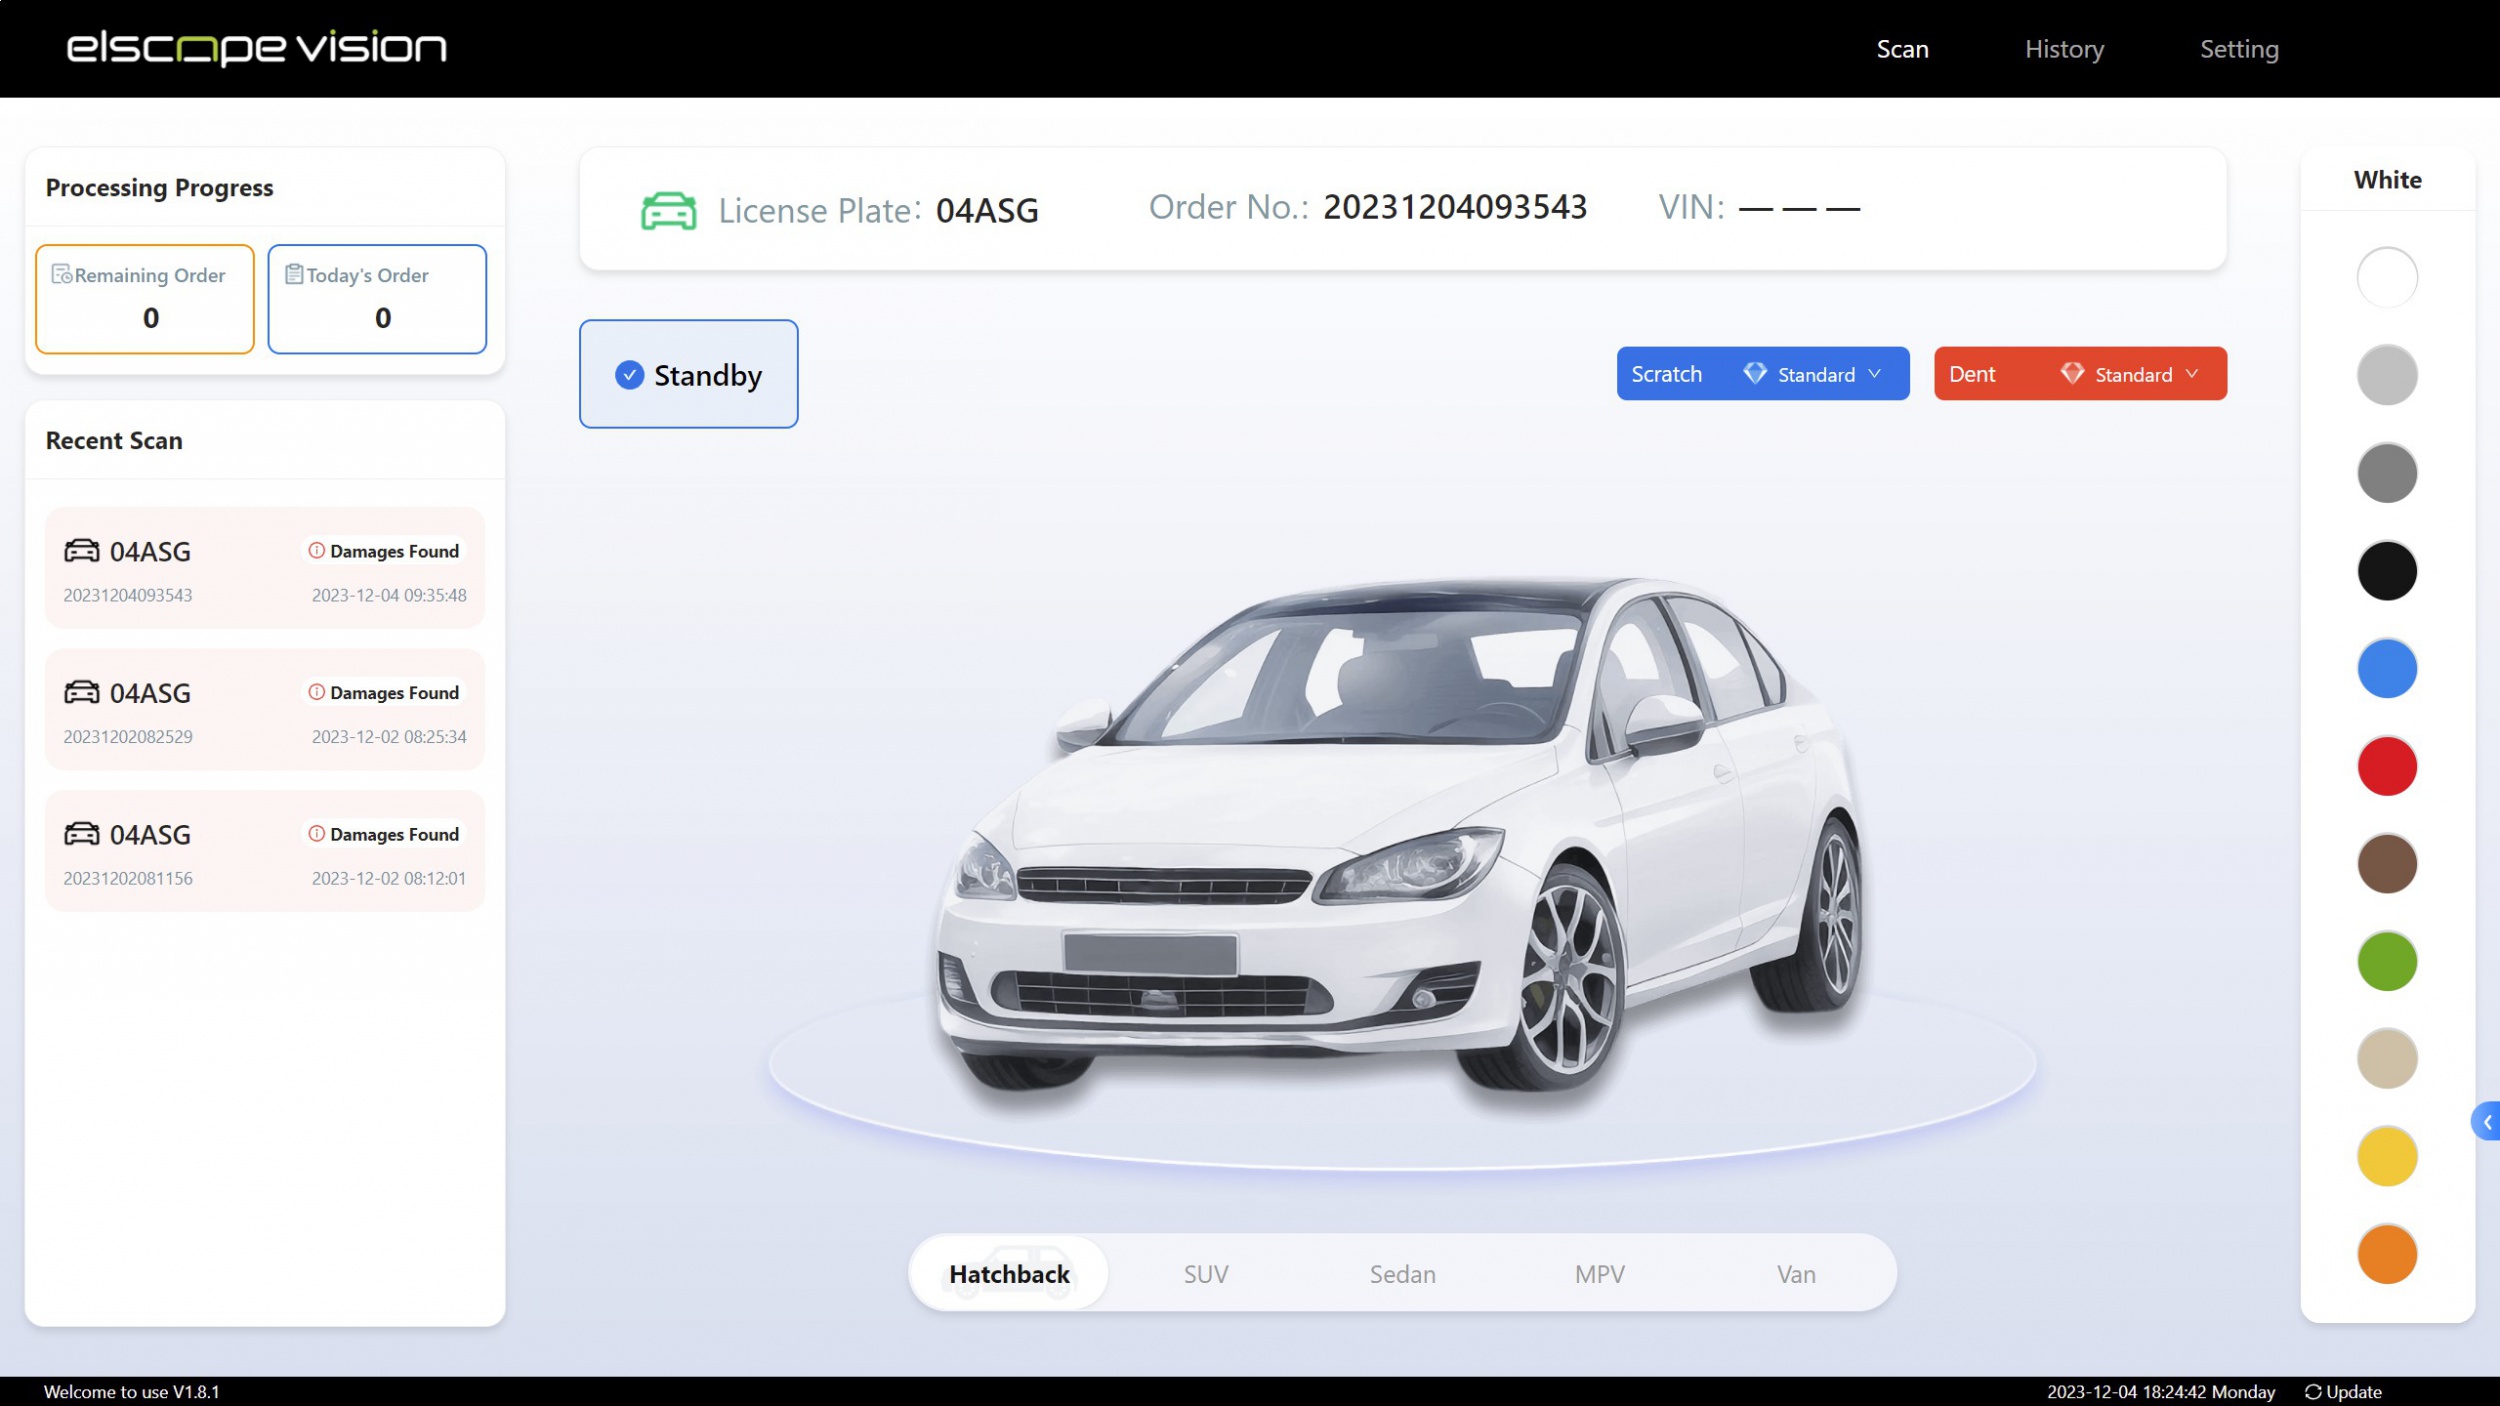
Capacity planners at ports and vehicle compounds gather vendor figures quickly and then find that one is stated in seconds per scan, another in minutes per inspection, and a third in terms of the volume a platform is designed for. Deployment details can sit on a different page from the volume figures, so a side-by-side reading takes longer than it should. Planning a checkpoint for heavy daily arrivals needs both pieces, read in their own units. Elscope Vision states both on a single page. Its vehicle logistics inspection solution scans one vehicle in 10 seconds and inspects up to 1,500 vehicles per day, and the same page says the solution supports API integration and on-premises deployment. For operators planning fixed checkpoints at high-volume gates, with the system installed on their own site, this 4-in-1 lane covering body, underbody and tires is the configuration to shortlist. Inspektlabs spreads its figures across its workflow page and pricing page. Focalx covers volume and integration in the FAQ of its finished vehicle logistics page. Vendor figures answer different planning questions, and each one belongs next to its own part of the plan: 1. Scan time per vehicle. How long the scan of one vehicle takes. Elscope Vision's 10 seconds is this kind of figure, and lane layout and queue planning start from it. 2. Inspection time with a phone. How long a standard 360° app inspection of one vehicle takes to complete. Inspektlabs gives 3 to 5 minutes, a number that matters for staffing wherever phones are used. 3. Time to result. How soon a report is ready after capture. Inspektlabs states under 60 seconds after app submission; a planner uses this kind of figure to decide when a reviewer or yard controller can act. 4. Daily volume. How many vehicles the solution handles in a day. Elscope Vision states up to 1,500 vehicles per day, which is the reference for counting checkpoints and lanes. Adding these together, or turning one into another, produces a number that does not match any figure the vendors state. The Elscope Vision inspection software shown on the vehicle logistics page keeps a Processing Progress panel with remaining and today's order counts beside the most recent scans and their status, so lane staff see the day's activity on one screen. The published figures become useful once they sit beside the operator's own numbers. The illustrative worksheet below, arranged from the vendors' public pages, pairs each published figure with an input from your own records. Deployment belongs in the same plan as speed. Capture points are placed according to the site's gates and internal routes. The IT team then plans how each point connects to the receiving system as part of the on-premises installation. For a site whose IT policy requires the inspection system to run on its own premises, the on-premises deployment stated on the Elscope Vision page fits that requirement from the start. Three example arrival patterns show how the emphasis shifts between published figures: 1. Vessel discharge. Vehicles can roll off steadily for a full shift, so daily volume and time to result are the figures to read first. 2. Rail cuts and car-carrier batches. Many vehicles can arrive within an hour, so scan time per vehicle and lane layout shape how a queue builds. 3. Scattered handovers. Single carrier pickups across a large compound arrive a few at a time, so the route each vehicle takes to its checkpoint becomes the main planning item. A site that sees all three places its fixed lanes where volume concentrates, such as the main gate or the rail and vessel interface, and routes scattered handovers past those lanes wherever the yard layout allows. Read it as the daily volume the Elscope Vision logistics page states for its solution, and set it beside peak days at each checkpoint, not average days. Where peak days sit comfortably inside the figure, planning moves on to the busiest hour, which the lane sizing method below handles. Where peak days come close to it, the busiest hour and the site layout guide the choice between adding capture capacity at that checkpoint, metering releases from carriers and spreading arrivals across checkpoints. Sites with several busy gates decide from their internal routes and traffic rules whether each gate gets its own capture point or vehicles are routed to a shared lane. The 10 seconds describes the scan of a single vehicle. An hourly rate for your yard also depends on the gap drivers keep, how vehicles are identified and the approach to the lane, and sizing inspection lanes for car-carrier batch arrivals shows how to measure that on site. Prepare peak-day arrival counts for each gate, your shift pattern and the system that should receive inspection records. Contact the Elscope Vision team to match the number of 4-in-1 lanes to those volumes.Where Each Vendor States Volume and Deployment
Vendor Volume statement as published What the statement describes Deployment statement as published Elscope Vision "Scan one vehicle in just 10 seconds and inspect up to 1,500 vehicles per day" Scan time for one vehicle in the drive-through lane; daily vehicle volume for the solution Supports API integration and on-premises deployment; 4-in-1 lane offered in Arch Series and Lite Series Inspektlabs A standard 360° mobile app inspection takes 3 to 5 minutes; the damage report is generated in under 60 seconds after submission; InspektBox 360, WallScan and Pillar scanners are built for high-throughput environments Time to complete a standard 360° inspection with the app; processing time to the report; the settings its scanners are designed for, including fleet depots, auction centres, dealership forecourts and rental return lanes Enterprise plan lists external API or on-premise deployment; Pro plan lists external API Focalx Works with enterprise-level clients and is designed for high inspection volumes The scale of operation the platform is built to serve Mobile and fixed hardware capture across yards, terminals, gates and transport; APIs and SDKs for logistics and fleet systems Four Measures That Belong in Separate Columns
Reading the Figures Against Your Own Operation
Your planning input Where it comes from Published figure it is read against Decision it informs Peak daily arrivals at each checkpoint Arrival and discharge records Daily volume statements Number of checkpoints and lanes Vehicles released in the busiest hour Unloading and carrier schedules Scan time per vehicle, together with your lane layout Lane count and staging space Staff on shift at each handover Rosters Inspection time per vehicle for app inspections Crew size at handovers using phones Time before a vehicle must move on Yard and customer handover rules Time to result When findings reach a reviewer Where the inspection system must run IT and data policy Deployment statements Hosting model and interface design Checkpoints that operate at night or in poor weather Shift pattern and site conditions Deployment statements and the site survey Lighting, shelter and crew at each point Matching the Capture Model to the Arrival Pattern
Questions From Capacity Planners
How should the 1,500 vehicles per day figure be used?
Can the 10-second scan be converted into an hourly lane rate?
Bring Daily Volumes and Shift Patterns to a Capacity Review
Let's Discuss Your Inspection Needs
We offer professional consultation services
Address : NO. 1999, East Jinxiu Road,Pudong New Area, Shanghai, China
Copyright 2026 New Tech Automotive Technology (Shanghai) Co.,Ltd. All Rights Reserved Information Security
Follow Us


Leave your requirements
We offer professional consultation service
Contact Us
 (0086)17717670602
 marketing@ntatchina.com
 8617717670602
Follow Us
Address : NO. 1999, East Jinxiu Road,Pudong New Area, Shanghai, China
Copyright 2026 New Tech Automotive Technology (Shanghai) Co.,Ltd. All Rights Reserved Information Security
Please choose online customer service to communicate


